What’s Next for Transpacific Spot Rates After Recent Carrier Hikes
Recent carrier rate hikes bolster transpacific spot prices, but they might be reversed soon. Spot rates from the far east have stopped falling for now as peak season starts. Experts think these higher rates will not last long. Shippers and carriers should get ready for quick changes and should also expect spot rates to go down over time.
Route | Change Over Time | |
|---|---|---|
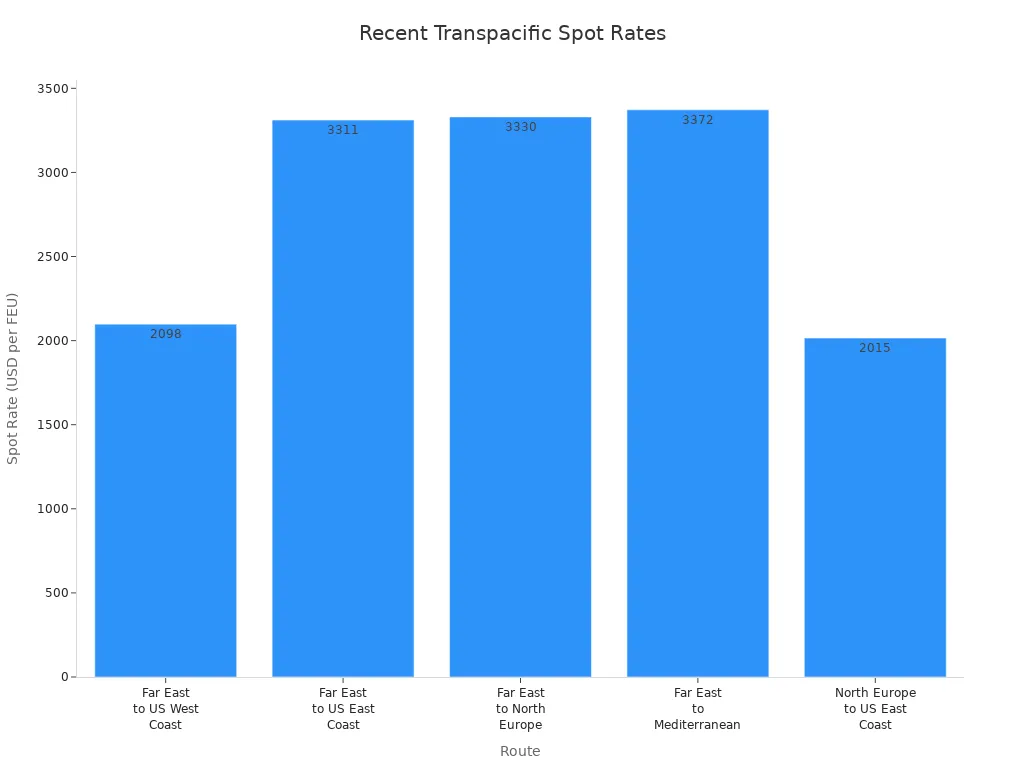
Far East to US West Coast | 2098 | Down 3% from July 31, down 62% since June 1 |
Far East to US East Coast | 3311 | Down 53% since June 15, down 9% since June 31 |
Far East to North Europe | 3330 | Down 2% compared to July 1, stayed flat after a 78% jump |
Far East to Mediterranean | 3372 | Down 7% since July 31, down 26% since June 15 |
North Europe to US East Coast | 2015 | Not specified |
Blanked sailings (TEU/week) | Increased from 30,000 to 57,000 | Not specified |
Spread between North Europe and Mediterranean | 42 | Almost the same from USD 1,765 on June 1 |
Carrier rate hikes bolster transpacific spot prices for now, but spot rates from the far east can change quickly.
Key Takeaways
Transpacific spot rates are going up now because carriers raised prices, but these higher prices might not stay for long. Shippers should get ready for rates to go down soon.
Carriers use blank sailings to control how much they ship. This helps keep spot rates steady when demand changes. Shippers should watch sailing schedules closely.
To handle changing rates, shippers can use real-time tracking, look at data to guess future prices, and make their supply chains more flexible.
Carrier Rate Hikes and Transpacific Spot Prices

Container Spot Rates: Current Trends
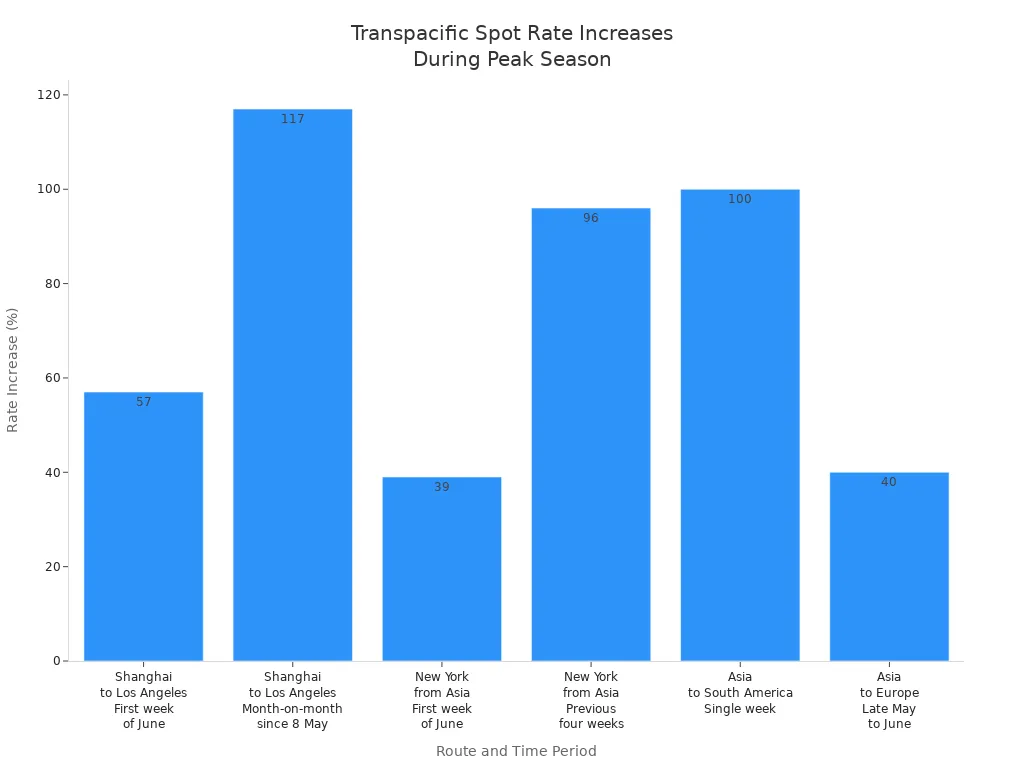
Container spot rates are changing in different ways. Carrier rate hikes make transpacific spot prices go up, especially when shipping is busy. In the past, ocean container spot rates jumped quickly after hikes. For example, the Shanghai to Los Angeles route went up 57% in early June. It also rose 117% since early May. New York from Asia saw a 39% increase in the first week of June. It jumped 96% over the last four weeks. Asia to South America and Asia to Europe had big rate increases too.
Route | Rate Increase (%) | Time Period |
|---|---|---|
Shanghai to Los Angeles | 57 | First week of June |
Shanghai to Los Angeles | 117 | Month-on-month since 8 May |
New York from Asia | 39 | First week of June |
New York from Asia | 96 | Previous four weeks |
Asia to South America | 100 | Single week |
Asia to Europe | 40 | Late May to June |
Many things have caused rates to stop falling or go up. Carriers changed how many ships are available. This made shipping choices fewer. Demand changed because e-commerce volumes went up and down. Tariff changes, like the US stopping the de minimis exemption for Chinese exports, also affected the market. All these things together made ocean container spot rates stop dropping for now.
Note: Carrier rate hikes make transpacific spot prices go up, but things can change fast.
Sustainability of Recent Hikes
It is not clear if these hikes will last. Carrier rate hikes make transpacific spot prices go up for now, but what happens next depends on many things. The third quarter is usually the busiest time for ocean freight. This helps keep demand strong. Carriers add more sailings only when they know demand is high. There is not much space, even though shipping volumes are lower than before the pandemic. This keeps ocean spot rates higher.
Executives think volume will go up a little and rates will go up more in 2025.
Customers are more willing to accept rate hikes now.
Less capacity is in the market, and freight volumes should rise, which helps keep rates high.
"A theme of cautious optimism emerged, with many executives anticipating low-to-mid-single-digit increases in volume and mid-to-double-digit rate increases for 2025."
Freight rates will likely go up as the market gets better. Executives say customers now accept rate hikes more easily. Less market capacity and more freight volume help keep ocean container spot rates high.
Blank sailings and general rate increases (GRIs) are important for short-term transpacific rates. From July 7 to August 10, carriers plan to cancel 49 sailings on big trade routes. Most of these, 57%, are on the trans-Pacific eastbound route. Carriers announced GRIs for July 15 and August 1. These affect all U.S. and Canadian import destinations. Even with these changes, spot rates kept falling for five weeks in a row. Asia–USWC routes dropped 2–3% each week. Spot rates are down 24–60% from their highest levels on key Asia–North America trades.
Transpacific spot rates dropped because there were too many ships.
Carriers had trouble keeping rate hikes, so people worry about peak season surcharges.
Carrier rate hikes make transpacific spot prices go up for now, but the market changes a lot. Ocean container spot rates may not stay high if demand goes down or if carriers add more ships. Shippers and carriers should watch these changes closely and be ready to adjust.
Drivers of Transpacific Trade Rates
Capacity and Blank Sailings
Capacity on the transpacific trade route changes fast. Carriers change how many ships they use to match demand. In May 2025, carriers cut capacity to the US West Coast by 30%. They did this because they thought fewer goods would ship after tariffs went up. In June 2025, they added back 28% more capacity. This happened when tariffs dropped and demand changed.
Date | Capacity Change | Notes |
|---|---|---|
May 2025 | -30% (USWC) | Carriers expected fewer shipments after tariffs increased. |
June 2025 | +28% | Capacity went up after tariffs dropped and demand shifted. |
Blank sailings help control how much space is open for shipping. In the week starting May 5, blank sailings hit 42%. This made less space for containers. Between weeks 18 and 22, carriers canceled 75 sailings. Most of these, 61%, were on the transpacific eastbound route. These moves help keep spot rates steady when demand drops.
Carriers use blank sailings to control too much space and keep rates steady when trade is uncertain.
Demand and Peak Season
Demand for container shipping from asia shapes the market. This year, demand has gone down. There is no usual peak season. ZIM’s CEO said there is no more growth in freight volumes or earnings. Japan’s exports to the US dropped by 10.1% in July. Car exports fell even more. Ocean Network Express saw a small rise in volume when tariffs paused. But the market is still not stable.
Forecasts show shipping demand and freight rates are dropping a lot.
Freight rates from asia to the US fell 10% in one week and 25% in four weeks.
In past peak seasons, spot rates from asia went up fast, but this year rates are lower than before.
Demand for container shipping from asia is still weak. Because demand has not come back, rates stay low.
Tariffs and Geopolitics
Tariffs and geopolitics affect transpacific trade a lot. New tariffs, like the Liberation Day tariffs in August 2025, made blank sailings go up and changed trade routes. Ongoing tariff changes make global trade uncertain. This affects both demand and how many ships are used.
Tariff Event | Date | Impact on Trade Rates |
|---|---|---|
Liberation Day Tariffs | August 7, 2025 | More blank sailings and new trade routes because import costs to the U.S. went up. |
Ongoing Tariff Adjustments | 2025 | Made global trade less certain and changed demand and ship use. |
Geopolitical problems, like the Israel-Iran conflict, can mess up shipping routes and make costs higher. Shippers now look at Thailand, Cambodia, and Vietnam to avoid tariffs on goods from asia. Political problems and changes in how people spend money make the transpacific trade market even more unstable.
Carrier Actions and Market Impact
Blanked Sailings Effect
Carriers use blank sailings to control how many ships are working. When they cancel sailings, fewer ships carry goods across the Pacific. This helps balance supply and demand. Recent blank sailings made spot rates drop a lot.
Container spot freight rates on transpacific trades fell 20% for Asia-US west coast routes.
Asia-US east coast prices dropped 13%.
Overall, transpacific spot rates lost 40% of their value in just two weeks.
Carriers canceled 72 sailings between April 21 and May 25. This was 10% of all planned sailings. The table below shows how often blank sailings happened in recent months:
Date Range | Number of Blank Sailings | Percentage of Capacity |
|---|---|---|
April 28-May 3 | 10 | 28% |
May 12-18 | 10 | 25% |
Since June, the transpacific route has had many schedule changes. These actions show ocean container shipping can change fast when the market does.
General Rate Increases (GRIs)
Carriers announce general rate increases (GRIs) to raise prices. The latest GRIs on the transpacific trade lane are:
Route | Rate Increase | New Rate (per feu) |
|---|---|---|
Shanghai to Los Angeles | 8% | |
Shanghai to New York | 12% | $3,677 |
Even with these changes, GRIs have not kept spot rates high. Too many ships make prices go down. Carriers often take back GRIs and Peak Season Surcharges when rates fall. This shows it is hard to keep rates high in asia-north america trades.
Temporary vs. Long-Term Changes
Carriers try to keep ocean container shipping rates steady with GRIs and FAK hikes. Spot rates go up and down, which shows things are not certain. Carriers like MSC cancel sailings when rates drop. They do this to match how much space is needed. These actions mean most rate changes do not last long. Long-term changes depend on the market and demand. Ocean container shipping changes quickly, so it is hard for carriers to keep rates high for a long time.
Outlook for Transpacific Spot Rates
Downward Trend Expectations
Market experts keep watching spot rates on transpacific routes. Forecasts say average spot rates will not go back to pre-pandemic levels soon. Prices have dropped a lot and now stay close to early 2024 numbers. Shipping volumes need to go up for prices to rise, but recent data shows only short jumps. For example, the Lunar New Year made rates go up for a short time, but they fell again soon after. The main trend is lower average spot rates, especially as more ships are added and demand stays weak.
Carriers have a hard time managing how many ships they use. Many analysts think more ships will make average spot rates drop even more. Emily Stausbøll, a senior shipping analyst at Xeneta, said:
“Carriers are trying to manage capacity, but they may be fighting a losing battle and have no choice but to accept lower freight rates.”
Average spot rates for North America routes have gone down. Rates from China to the US West Coast and East Coast dropped by 7% lately. Daily spot rates are now about $3,500 per FEU, down from $5,800 just last week. Lower demand and more ships keep making prices fall. The market thinks average spot rates will stay low as carriers find it hard to keep prices high.
Volatility and Uncertainties
Transpacific spot rates change a lot. Many things make the market uncertain:
Tariff changes make container shipping demand jump up and down.
New tariffs on imports from China add more surprises.
Too many ships in the market push spot prices down, and legal questions about tariffs make it worse.
A short tariff truce in May made demand go up fast. Spot freight rates rose by 1.5 times on the china-us east coast route. When new tariff deadlines came in July and August, demand dropped and spot rates fell again. These events show spot rates can change very quickly.
Market experts think about different ways spot rates could go:
Scenario | Description |
|---|---|
1 | MSC leads the market and other shipping companies try to keep up |
2 | MSC's lead is limited |
3 | The United States becomes a strong maritime power again |
Spot rates might stay steady if carriers control how many ships they use. Rates could go up if demand grows, but most signs show prices will keep falling. If carriers cannot control supply, average spot rates will probably drop. The market also watches for changes in us import volumes and new tariffs, which could make prices change even more.
Shippers and carriers need to pay close attention. The market changes fast, and spot rates react quickly to demand, supply, and new rules. The future for spot rates is still not clear, and most experts think prices will keep going down.
Shipper and Carrier Strategies
Navigating Rate Hikes
Shippers have new problems because shipping rates change a lot. Many shippers use foreign-trade zones to wait before paying tariffs. This helps them keep more money and deal with changing costs. Carriers change their routes and cancel some sailings to keep prices steady. Some rates went up for smaller customers because of new rules. Spot rates on big Asia–U.S. routes are still going down, but not as fast. Shippers and carriers need to watch the market and be ready to change plans quickly.
Risk Mitigation
It is important to manage risk in shipping today. Shippers use different ways to lower the problems from changing rates:
They use many supply chains and worker locations to avoid big tariffs.
They check trade agreements so they know about new customs rules.
They use tariff engineering to save money.
Technique | Description |
|---|---|
Lets shippers see every step and act fast. | |
Data-Driven Forecasting | Uses data to guess trends and get better rates. |
Building Flexibility | Uses brokers for faster service when shipping is busy. |
Contingency Planning | Has backup routes and checks weather for smooth shipping. |
Cybersecurity | Keeps shipping data safe from threats. |
Adapting to Market Shifts
Shippers and carriers must change as shipping rules change. Many companies get ready for new import limits and tariff laws. Businesses build local networks to make shipping more reliable. Flexible partners are very important now. New laws ending the de minimis exemption by July 2027 make companies change their shipping plans. Many look for new customs choices and use ocean shipping to send more goods together. Carriers also change their groups and offer new contracts. Shippers work with many carriers and want flexible deals to keep up with changes in shipping.
Transpacific spot rates are going down. Carriers have too many ships and not enough demand. The recent price increases may not last long. Shippers and carriers should get ready for quick changes. They can do this by:
Getting more inventory and using different suppliers
Booking space early for important products
Using digital tools to see supply chain steps
Making backup plans for tariffs and strikes
Staying flexible with how they work
FAQ
What makes transpacific spot rates change so fast?
Carriers change ship schedules and use blank sailings. Demand goes up or down, and new tariffs matter too. The market can be different every week.
How do blank sailings help carriers with rates?
Blank sailings mean fewer ships are working. Carriers do this to match how many goods need shipping. Spot rates usually stop changing a lot after blank sailings.
Tip: Shippers should watch for blank sailing news to plan better.
When do experts think spot rates will be normal again?
Year | Expected Rate Trend |
|---|---|
2024 | Rates stay low |
2025 | Slow recovery |
Experts say rates will not go back up until more people need shipping.
See Also
Discovering Innovations in Sea Freight Logistics for 2024
Understanding Current Trends in Logistics Risk Management
A Detailed Look at the Future of LTL Freight
Getting Prepared: New Transport Technologies for Supply Chains
Enhancing Efficiency: JUSDA Introduces New Warehousing Solutions