The State of the Freight Market: Volatility, Cost Pressure and Complexity

The freight market faces a period of intense volatility and rising cost pressures. Logistics professionals encounter unpredictable changes that demand quick adaptation. Ocean freight rates have surged by up to 3% on key routes, and air freight rates climbed 1-4%. Persistent container shortages and port congestion add new layers of complexity.
These challenges push every market participant to rethink freight strategies and reflect on how disruptions impact their operations.
Key Takeaways
The freight market faces high volatility due to supply-demand imbalances, rising fuel costs, labor shortages, and global disruptions.
New trade policies and shifting supply chains increase complexity, requiring companies to adapt routes and fleet strategies quickly.
Technology like real-time data, AI, and automation helps improve tracking, reduce costs, and manage freight market risks effectively.
Strong collaboration among shippers, carriers, and brokers improves communication, reduces delays, and lowers overall costs.
Using predictive analytics, scenario planning, and diversification builds resilience and helps companies respond faster to market changes.
Freight Market Overview
Key Trends
The freight market continues to experience rapid changes. Volatility remains high as global events disrupt normal operations. Many companies in the freight and logistics sector face rising costs and new challenges. Freight market data shows that rates for ocean, air, and trucking have all increased. These changes force logistics teams to adapt quickly.
Supply chain disruptions have become more common. Weather events, geopolitical tensions, and labor shortages all play a role. Disruptions can cause delays, higher costs, and uncertainty for shippers and carriers. The market now demands more flexible strategies to manage these risks. Companies must monitor freight market trends closely to stay competitive.
Policy and Trade Shifts
Policy changes and trade shifts add another layer of complexity. Governments around the world have introduced new tariffs and trade barriers. These actions increase global trade volatility and reshape freight flows. The freight market must adjust to new rules and routes.
Manufacturers now diversify supply chains away from China-centric models. Apple, for example, has expanded operations in India and Vietnam.
Early signs show a realignment of freight corridors toward new Asia–Asia and Asia–Middle East routes.
Structural changes in aviation include a move from long-haul to more regional operations.
Freight operations require more agile fleet strategies to adapt to trade policy fragmentation.
Supply chain disruptions continue to challenge the market. Companies in the freight and logistics sector need scenario-based planning and strategic flexibility. These steps help them respond to ongoing disruptions and policy changes.
Volatility Drivers
Supply and Demand
Supply and demand imbalances drive much of the volatility in the freight market. When domestic freight demand rises faster than available capacity, rates surge in the spot market. Shippers often see rate fluctuations as inventory levels shift and truckload market conditions change. Carriers may reduce capacity during uncertain periods, which limits supply and increases volatility. Tariff uncertainty also impacts cross-border trade flows, causing some carriers to downsize fleets or lay off workers. This action restricts supply and leads to more unpredictable rates.
Factor | Description | Impact on Freight Market |
|---|---|---|
Tariff Uncertainty | Trade policy ambiguity | Carriers reduce capacity, increasing volatility |
Supply-Demand Imbalances | Inventory and truck capacity fluctuations | Rate volatility as demand and supply adjust asynchronously |
Rail Congestion | Delays at key rail hubs | Shifts demand to truckload, driving up truckload market rates |
Fuel and Costs
Fuel price changes remain a major driver of rate fluctuations and overall costs. The removal of Canada’s consumer carbon tax in April aimed to lower fuel costs, but other financial pressures kept freight pricing high. The industry also faces uncertainty from federal gas tax policy debates, which could affect infrastructure funding and future costs. Carriers must monitor these changes closely, as even small shifts in fuel prices can impact spot market rates and the broader truckload market.
Regulation | Description | Potential Impact on Freight Market |
|---|---|---|
Federal Gas Tax Holiday Opposition | Industry opposes short-term tax suspension | Could affect fuel costs and infrastructure funding |
Carbon Tax Removal | Canada’s consumer carbon tax removed in April | Expected to lower fuel costs, but no immediate pricing impact |
Labor and Capacity
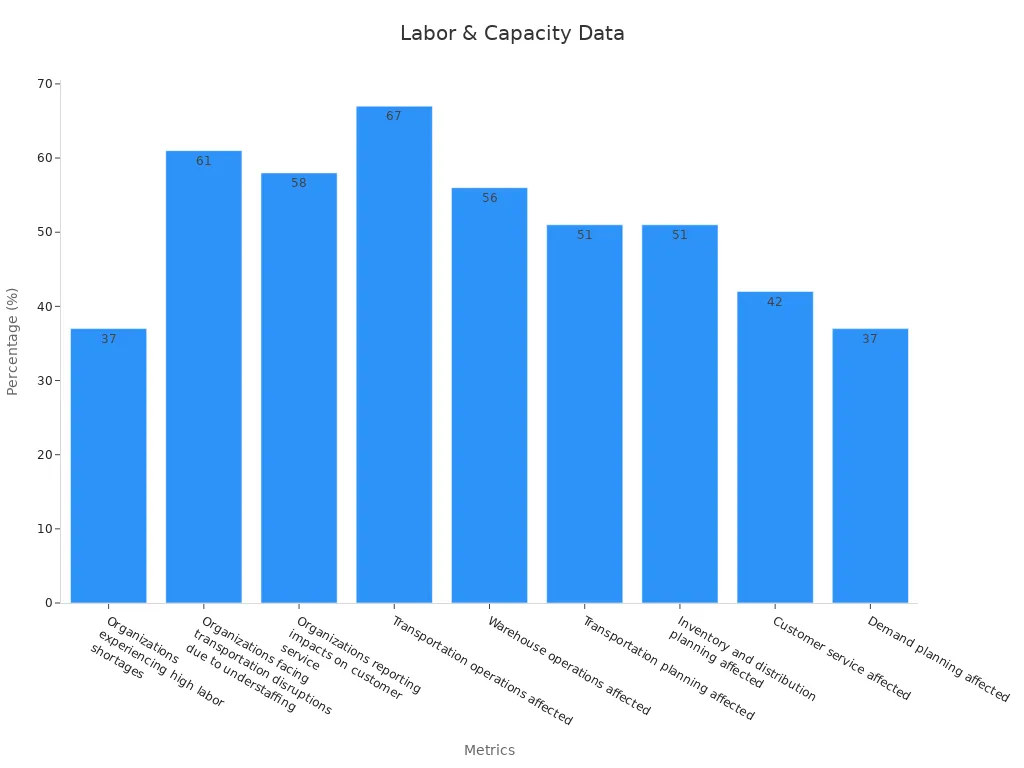
Labor shortages and capacity constraints add another layer of volatility to the freight market. Many organizations report high levels of transportation disruptions due to understaffing. The median employee age in warehousing, manufacturing, and transportation now stands at 45 or older, signaling an aging workforce. The U.S. labor market shows 8.1 million jobs available but only 6.6 million job seekers, intensifying competition for workers in logistics and the truckload market.
Metric / Area | Percentage / Data Point |
|---|---|
Organizations experiencing high labor shortages | 37% |
Transportation operations affected | 67% |
Warehouse operations affected | 56% |
Customer service impacted | 42% |
Regulatory changes, such as independent contractor classification debates and the FMCSA Young Driver Pilot Program, create further uncertainty. These shifts can either limit or expand the labor pool, directly affecting capacity and rates. As a result, shippers and carriers must stay alert to labor market dynamics to manage volatility in the spot market and truckload market.
Freight Market Volatility
Air Freight
Air freight stands out for its rapid and sometimes unpredictable rate fluctuations. Global air cargo spot rates dropped 4% year-over-year to $2.44 per kilogram in April 2025, even as air cargo volumes increased by 6%. This contrast shows that demand remains strong, but pricing does not always follow. Regional differences can be dramatic. For example, rates from Northeast Asia to North America rose 7% to $4.53 per kilogram, while the China to U.S. trade lane saw a sharp 14% rebound in spot rates from a recent low. These swings highlight the unique volatility in air freight compared to other modes.
Statistic / Insight | Air Freight Volatility Detail | Comparison / Context |
|---|---|---|
Global air cargo spot rates change | 4% year-over-year decline to $2.44/kg (April 2025) | Contrasts with 6% increase in air cargo volumes |
Regional rate variation | 7% increase in Northeast Asia to North America rates ($4.53/kg) | Rapid regional fluctuations |
China to U.S. volatility | 14% rebound in spot rates from May low | Sharp short-term swings |
Dynamic load factor | 57% capacity utilization | High sensitivity to capacity changes |
Sensitivity to tariffs | Costs more sensitive to tariff changes | Tariff-driven modal shifts |
Operational impact | Need for real-time audit and tracking | Higher complexity and volatility management |
Air freight rates respond quickly to changes in capacity, tariffs, and global events. The dynamic load factor, which measures capacity utilization, reached 57%, making rates highly sensitive to even small shifts in available space. Tariff changes often push shippers to switch modes, increasing volatility in air freight. Companies must use real-time data and frequent audits to manage these rapid changes.
Ocean Freight
Ocean freight market volatility often follows a different pattern. Seasonal demand spikes, such as those from July to October and before the Lunar New Year, drive up demand and rates. Geopolitical events, including trade wars and tariffs, can trigger sudden surges as importers rush to move goods. Port congestion, caused by weather, labor strikes, or increased traffic, reduces effective supply and delays vessel turnaround, adding to volatility.
Fleet growth sometimes outpaces demand, leading to oversupply and downward pressure on rates.
Carriers adjust to market conditions by introducing General Rate Increases (GRIs) and surcharges like Peak Season or Port Congestion fees.
During off-peak periods or economic downturns, carriers may blank sailings to reduce capacity and stabilize rates.
The container shipping market remains highly volatile, with unexpected disruptions causing rapid changes in rates and capacity utilization.
In 2024, the supply of ocean freight capacity reached a 16-year high, with 2.34 million TEUs delivered in the first nine months. However, events like the Red Sea crisis offset these gains by forcing longer sailing routes and increasing transit times. This neutralized the impact of new supply outpacing demand. Looking ahead to 2025, supply growth is expected to continue, with major carriers expanding their fleets. Changes in carrier alliances and new environmental regulations will also shape volatility and pricing. The Far East to Mediterranean route, for example, saw a 60.1% increase in carbon emissions per tonne due to rerouting, showing how disruptions can affect both rates and sustainability.
Staying informed on ocean freight trends helps logistics teams build resilient strategies and manage freight market volatility.
Trucking Rate Volatility
Trucking rate volatility remains a defining feature of the North American freight market. The spot market shows frequent rate fluctuations, with the all-in cost-per-mile index rising from 118 to 119.5 in the first quarter. Spot rates often shift between premiums and discounts compared to contract rates. For example, in late 2024, spot rates held an 11-week premium before dropping to a 5%-8% discount in early 2025.
Monthly rate performance shows January holding gains after the holidays, followed by normalization in February and March.
Seasonal shipping events in the second quarter, such as produce season and Memorial Day, disrupt capacity and drive up rates.
Carrier operating costs have increased by about 34% since 2014, making it harder for rates to fall significantly.
The spot versus contract rate dynamic continues to shift, with contract rates rising 1.4% year-over-year in early 2025.
Market cycles show typical seasonal patterns, but short-term dips or spikes do not always signal a major trend change.
Trucking rate volatility is influenced by capacity attrition, macroeconomic factors, and ongoing cost pressures. Early indicators in the second quarter suggest a higher baseline for rates, but not a steep increase. Shippers and carriers must monitor these trends closely to manage costs and maintain service levels in a volatile transportation market.
Companies that track rate fluctuations and understand the drivers of trucking rate volatility can better navigate the challenges of the freight market.
Complexity in Freight
Regulatory Changes
Regulatory shifts add new layers of complexity to the freight market. Companies must adjust to changing rules in every country where they operate. For example, studies from Guangdong show that cross-border e-commerce and logistics face many regulatory and operational challenges. Low synergy between these sectors results from complex rules, poor information sharing, and slow technology adoption. As cross-border trade grows, the need for better collaboration and integration becomes urgent. Businesses often hire local experts and use digital tools to stay compliant and avoid costly disruptions.
Regulatory frameworks change quickly, making it hard for companies to keep up.
Lack of trust and information sharing between logistics and e-commerce companies causes planning and delivery problems.
Customs management now relies on pre-clearance and partnerships with brokers to reduce delays.
Companies that monitor regulatory changes closely can reduce risks and respond faster to supply chain disruptions.
Technology and Data
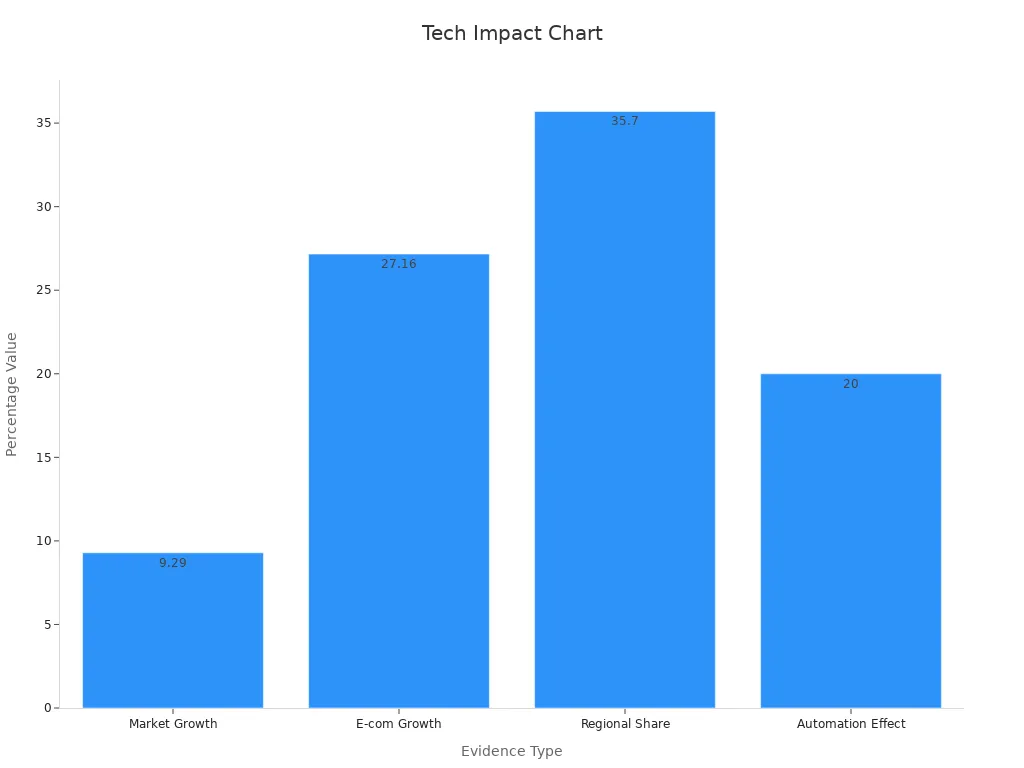
Technology now plays a key role in managing freight operations. The freight management system market reached $17.75 billion in 2024 and is expected to more than double by 2033. Companies use AI, IoT, and blockchain to improve supply chain visibility and real-time tracking. Automation reduces manual work and errors, making operations more efficient. Devices like OnAsset Intelligence’s Sentry 600 FlightSafe provide real-time updates on air shipments. North America leads in technology adoption, but Asia-Pacific and Europe are catching up due to e-commerce growth and new regulations.
Evidence Type | Description |
|---|---|
Market Size and Growth Figures | Freight management system market valued at USD 17.75 billion in 2024, projected to reach USD 39.76 billion by 2033. |
Technology Integration | AI, IoT, blockchain, and automation improve tracking and decision-making. |
Operational Benefits | Technologies optimize routes, reduce costs, and support sustainability goals. |
Cross-Border Challenges
Cross-border freight faces unique disruptions. Operating costs for international shipments rose by 20% in 2024. Diesel prices increased, and inflation pushed up the cost of spare parts. Companies also deal with cargo theft, road blockades, and seasonal driver shortages. Infrastructure differences, such as road quality and port access, create more hurdles. Political uncertainties and tariff threats add to the risk of disruptions. Companies like Ford and Coca-Cola use technology, nearshoring, and strong partnerships to manage these challenges.
Accurate documentation and digital tools help reduce border delays.
Specialized equipment, like temperature-controlled trailers, is often needed for certain shipments.
Postal strikes and weather events can disrupt mail and package flows, causing further delays.
Continuous recalibration and risk management help companies stay resilient against ongoing disruptions and supply chain disruptions.
Strategies for Freight
Predictive Analytics
Predictive analytics has become a cornerstone for building resilience in the freight industry. Companies use advanced algorithms and machine learning to forecast demand, optimize inventory, and allocate resources more efficiently. This approach reduces uncertainty and helps organizations respond quickly to changes in the market.
AI-driven demand forecasting lowers supply chain deviations by 20% to 50%.
Operational performance improves by 65% due to fewer lost sales and better product availability.
Predictive analytics delivers cost savings of 10% to 15%.
Automation powered by AI manages 50% of workforce operations, increasing adaptability.
Major players like Western Digital, Walmart, UPS, and DHL have adopted predictive analytics to protect their supply chains and optimize operations. For example, UPS’s ORION platform uses dynamic route optimization, saving between $100 million and $200 million each year. These tools support data-driven decision making and improve market visibility, allowing companies to anticipate disruptions and adjust strategies before problems escalate.
Predictive analytics also enhances key performance metrics. Companies see reduced lead times, better inventory turnover, and improved service levels. Real-time market intelligence, combined with predictive models, enables logistics teams to make informed choices that strengthen supply chain resilience.
Real-Time Data
Access to real-time data transforms freight operations. Companies rely on Transportation Management Systems (TMS), Warehouse Management Systems (WMS), and IoT devices to track shipments, monitor inventory, and optimize routes. Real-time market intelligence provides immediate insights, helping teams identify issues and resolve them before they cause delays.
Companies use barcode systems and inventory management software to maintain real-time inventory accuracy. GPS and IoT devices track transit times, delivery accuracy, and fuel consumption. Interactive dashboards visualize performance data, enabling quick operational adjustments. Regular review of key performance indicators (KPIs) supports continuous improvement and aligns operations with business goals.
Real-time market intelligence not only improves operational efficiency but also supports agility and data-driven decision making. Teams can respond to disruptions faster, reduce unnecessary costs, and maintain high service levels in a dynamic market.
Scenario Planning
Scenario planning prepares freight organizations for unexpected events. By simulating different market conditions, companies can develop contingency plans and strengthen their response to disruptions. Programs like the Freight Demand Modeling and Data Improvement initiative provide tools and case studies that help planners forecast freight flows and operational challenges.
The National Cooperative Highway Research Program offers scenario planning models that address infrastructure investment, climate change, technology advances, and demographic shifts. These frameworks guide state and regional planners in forecasting and managing freight transportation challenges. The Federal Highway Administration’s scenario planning guidebook outlines a structured approach, helping agencies align their strategies with real-time market intelligence and data-driven decision making.
Scenario planning enables logistics teams to test their networks against various risks. This process builds agility and data-driven decision making into daily operations, ensuring companies can adapt quickly to changes in the market.
Scenario planning empowers organizations to anticipate disruptions and maintain supply chain resilience, even in unpredictable environments.
Diversification
Diversification reduces risk and increases flexibility in freight operations. Companies spread their supplier base across regions, maintain buffer stock levels, and develop relationships with multiple carriers. This approach cushions the impact of delays, shortages, or geopolitical disruptions.
Supplier diversification across regions lowers disruption risks.
Buffer stock helps manage delays or shortages.
Contractual safeguards, such as risk-sharing clauses, protect against unexpected costs.
Technology and automation provide real-time visibility and risk flagging.
Continuous risk monitoring and strong supplier relationships support joint risk management.
Organizations also use alternative suppliers and backup logistics providers to ensure continuity. Regular evaluation of geopolitical and environmental risks keeps companies prepared for sudden changes. Focusing on sustainability and ethical sourcing further strengthens resilience and protects reputation.
Diversification, combined with real-time market intelligence and data-driven decision making, enables freight companies to maintain agility and adapt to shifting market conditions. This strategy supports long-term growth and stability in a complex logistics environment.
The freight market faces volatility, rising costs, and growing complexity. Logistics teams need proactive, data-driven strategies to stay ahead. Technology and strong partnerships help companies turn challenges into opportunities.
Smart leaders assess their freight operations often and adapt quickly.
Next steps for logistics professionals:
Review current processes and identify gaps.
Invest in real-time data tools.
Build strong relationships with partners.
FAQ
Why is technology important in freight management?
Technology improves visibility and efficiency. Tools like TMS and IoT devices help track shipments, optimize routes, and reduce manual errors. Companies gain better control over operations.
Tip: Adopting new technology helps teams respond faster to disruptions.
What strategies help build resilience in freight operations?
Diversify suppliers and carriers
Use predictive analytics
Plan for different scenarios
Build strong partnerships
These steps help companies adapt to change and protect their supply chains.
See Also
Understanding Inflation Effects On Supply Chain Challenges
Transforming Logistics Through Cutting Edge Supply Chain Advances
Enhancing Supply Chains With Effective Risk Management Strategies
Addressing Global Supply Chain Growth And Expansion Issues
Complete Guide To Managing And Overcoming Supply Chain Disruptions