How to build a Winning Freight Procurement Strategy

A Freight Procurement Strategy shapes how you select carriers, negotiate rates, and manage shipping performance. You drive efficiency and reliability by aligning procurement with your supply chain goals. Automation and data tools help you reduce errors and boost accuracy.
The US freight and logistics market could reach $1.62 trillion by 2029.
65% of shippers now focus on performance, not just cost.
Automation can cut errors by up to 50% and increase supply chain revenue growth.
Take time to evaluate your current process. You may find new ways to improve results and stay competitive.
Key Takeaways
Set clear goals like cost reduction, supplier performance, and risk management to guide your freight procurement strategy.
Use real-time data and automation to improve accuracy, reduce errors, and find better shipping rates.
Evaluate suppliers with measurable metrics such as on-time delivery and defect rates to choose reliable partners.
Build strong relationships with carriers through collaboration and regular reviews to improve service and save costs.
Embrace new technologies and risk management tools to stay competitive and keep your supply chain resilient.
Freight Procurement Strategy Overview
A strong Freight Procurement Strategy gives you a clear path to manage your shipping needs. You set the direction for how your business selects carriers, negotiates rates, and ensures reliable deliveries. When you align your strategy with your logistics goals, you create a foundation for cost savings, risk reduction, and better supplier performance.
Tip: Aligning your Freight Procurement Strategy with your logistics objectives helps you respond quickly to market changes and customer demands.
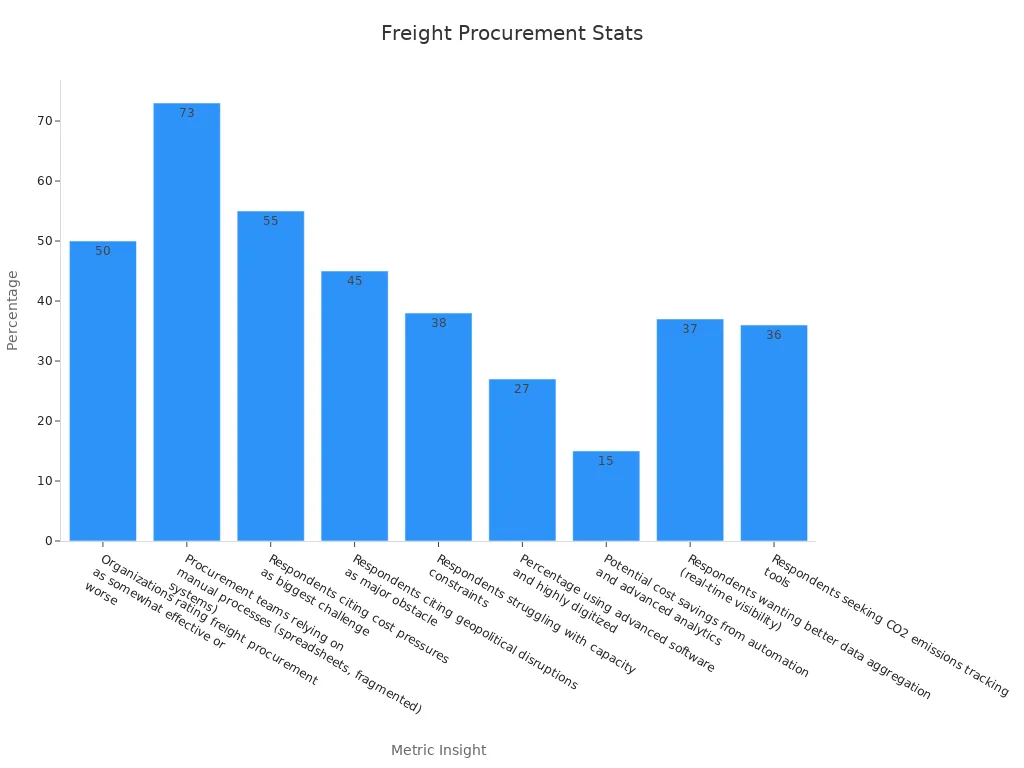
Recent industry studies show that many organizations still struggle with procurement effectiveness. Only 27% use advanced software, while 73% rely on manual processes. This gap leaves room for improvement through automation and data-driven decision-making.
Key Goals
You need clear goals to guide your Freight Procurement Strategy. These goals help you measure progress and drive continuous improvement. Here are some key objectives you should consider:
Quantifiable Benefit | Description |
|---|---|
Cost Reduction | Optimize sourcing and negotiation to lower expenses and boost profits. |
Supplier Performance Improvement | Monitor and collaborate with suppliers to improve delivery, quality, and responsiveness. |
Identify and address risks early to keep your business running smoothly. | |
Process Efficiency | Streamline workflows to save time and reduce costs. |
Sustainability Initiatives | Set targets for responsible sourcing and lower your carbon footprint. |
Innovation | Encourage suppliers to bring new ideas and solutions. |
Compliance | Follow legal and regulatory rules to avoid problems. |
Quality Assurance | Maintain high standards through regular checks and audits. |
Stakeholder Satisfaction | Meet the needs of both internal and external partners. |
Talent Development | Invest in training to build a skilled procurement team. |
When you focus on these goals, you create a strategy that delivers real results. For example, automation and advanced analytics can help you save up to 15% on freight costs. Data-driven platforms also support sustainability, reducing carbon emissions by 10-15%.
Short-Term vs Long-Term Focus
A successful Freight Procurement Strategy balances immediate needs with future growth. In the short term, you might focus on securing capacity, managing costs, and responding to disruptions. For example, real-time market intelligence tools help you monitor freight rates and spot supply chain risks quickly.
In the long term, you build strong relationships with carriers, invest in technology, and develop your team’s skills. You also plan for sustainability and compliance, which are becoming more important each year. T-shaped procurement teams—those with deep expertise and broad knowledge—help you make faster decisions and break down silos.
Short-term actions:
Secure reliable carriers during peak seasons.
Use automation to speed up rate management and contract processes.
Respond quickly to market changes and disruptions.
Long-term actions:
Invest in digital tools and AI-powered platforms for better forecasting and risk management.
Develop partnerships with carriers for innovation and sustainability.
Train your team to handle new challenges and technologies.
Case studies show that companies using automation and AI see big improvements. For example, Puma’s logistics team improved efficiency by 50% with an AI-powered platform. Automated workflows help you manage rate volatility and supply chain disruptions. AI also supports compliance by tracking emissions and predicting risks.
Note: Only half of organizations rate their freight procurement as effective. By focusing on both short- and long-term goals, you can move ahead of the competition.
Market Knowledge
Understanding the freight market gives you a strong advantage in procurement. You need to know what drives carrier performance, how rates change, and which partners offer the best value. Deep market knowledge helps you make better decisions and respond quickly to changes.
Tip: Reliable and accurate market data helps you select logistics partners who meet your needs. A recent survey found that:
Reliability and accuracy matter most for 32.1% of shippers.
Price comes next at 20.5%.
Geographic coverage and customer service also play key roles.
92% of logistics professionals stay engaged with freight data after the pandemic.
70% of cargo owners use market data to justify procurement choices.
76% rely on real-time updates for freight decisions.
Supplier Research
You need to evaluate suppliers using clear, measurable criteria. This process helps you find partners who deliver on time, maintain quality, and support your business goals. Use performance metrics to compare suppliers and track their results.
Metric Name | Description | Measurement Type | Example / Explanation |
|---|---|---|---|
On-time Delivery Performance | Percentage of orders delivered on or before the agreed date | Percentage | Low rates show reliability issues or capacity problems |
Defect Rate | Percentage of defective units received out of total units | Percentage | 2% defect rate means 20 defects per 1,000 units |
OTIF (On-time and In-full) | Percentage of orders delivered both on time and complete | Percentage | Poor OTIF can cause stockouts and delays |
SCAR Rate | Frequency of corrective action requests due to quality issues | Rate / Frequency | High rates signal ongoing quality problems |
RMA Rate | Percentage of products returned due to defects or quality issues | Percentage | High rates reflect customer dissatisfaction |
Lead Time Variability | Consistency of lead times measured by standard deviation | Statistical measure | High variability disrupts schedules |
Cost of Quality | Expenses related to quality assurance and defect correction | Cost metric | High costs show inefficiencies |
Supplier Relationship Index (SRI) | Overall supplier performance and relationship quality | Index / Score | Low SRI means strained relationships |
You can use these metrics to create a supplier scorecard. This approach helps you compare options and choose the best partners for your freight needs.
Internal Needs Assessment
You must understand your own requirements before you select suppliers. Quantitative analysis supports this process by giving you clear data to guide your choices.
Gather and analyze data on cost, capacity, and financial stability.
Use scoring systems to rank vendors based on measurable criteria.
Track performance metrics and service level agreements for ongoing evaluation.
Compare commercial factors, technical compliance, and financial records.
Use structured, data-driven methods to reduce risks and improve outcomes.
When you use these methods, you make informed decisions that match your business goals. This approach helps you build a reliable and efficient freight procurement process.
Rate Benchmarking
Real-Time Data Use
You need accurate, up-to-date information to benchmark freight rates effectively. Real-time data helps you compare your current rates with the market and spot cost-saving opportunities. Technology-driven workflows let you quickly identify better rates and more reliable carriers. This approach can reduce your full truckload freight spend by 2-3%. You also lower your exposure to the spot market by 10-25% when you use carrier performance data to select partners for critical lanes.
Using real-time data means you move beyond outdated rate sheets. You can benchmark current pricing, forecast trends, and evaluate carriers using key performance indicators like on-time delivery and tender acceptance.
Several industry tools and indexes support this process:
Freightos Baltic Index (FBX): Tracks global ocean container freight rates in real time.
Freightos Air Index (FAX): Provides global air freight pricing for accurate benchmarking.
Alpega’s benchmarking solution: Offers automated rate comparison, integrates with TMS and ERP systems, and delivers actionable insights.
DAT iQ Benchmarking and Ratecast: Supplies predictive analytics and market insights for smarter bids and carrier selection.
These resources cover billions of dollars in freight spend and thousands of shipping lanes. They help you make smarter decisions, improve service reliability, and build stronger carrier relationships.
RFP Process
A well-structured RFP (Request for Proposal) process ensures you get the best rates and service from your carriers. Digital automation and centralized data can reduce your internal coordination time by up to 70%. Pricing errors drop by over 90%, and RFP win rates can rise by as much as 35% when you use platforms like Cargo Chief’s C4.
Follow these steps to optimize your RFP process:
Use analytics dashboards to find cost-saving opportunities and select the right vendors.
Set clear evaluation criteria, such as cost-effectiveness and service reliability.
Automate planning and cost analysis to reduce manual errors.
Foster collaboration with vendors through centralized communication.
Optimize shipping lanes and modes for efficiency.
Track carrier performance with KPIs to ensure contract commitments.
Embrace new technologies and continuous improvement.
Agility matters. Moving away from annual RFP cycles to ongoing contract reviews helps you adapt to market changes and keep costs under control.
Negotiation & Relationships
Data-Driven Negotiation
You gain a strong advantage when you use data to guide your freight negotiations. Data helps you understand market rates, carrier performance, and your own shipping patterns. With this knowledge, you can set clear goals and walkaway points before you start talks. You also test supplier pricing ranges and avoid making unnecessary concessions.
Many companies have saved money by using these strategies:
Freight optimization and demand-based routing led to an 18% annual reduction in shipping costs for a mid-sized electronics firm.
Strategic partnerships with third-party logistics providers improved forecasting and cut delivery delays by 50%.
Intermodal strategies, such as shifting long-haul freight to rail, achieved a 23% cost reduction for a retail chain.
Transportation Management Systems and logistics automation produced 15% freight cost savings within six months for manufacturers.
Regular freight audits and invoice reviews uncovered overcharges and billing errors, leading to cost recovery.
You can also use benchmarking data or third-party quotes to anchor your negotiation position. Requesting 'elegant negotiables'—like better payment terms or added services—often brings high value at low cost. Always trade, never concede. For every concession you make, ask for something in return. Focus on immediate cost savings through renegotiated lower prices and volume discounts.
Tip: Regular contract audits and performance reviews help you spot hidden charges and renegotiate for better rates.
Carrier Partnerships
Building strong relationships with your carriers leads to better service and long-term savings. You should view your carriers as partners, not just vendors. When you collaborate, you improve forecasting, share data, and solve problems faster.
Consider these best practices:
Use freight brokers and 3PLs to access wider logistics networks and create competitive pressure.
Hold regular performance reviews to keep carriers accountable.
Share your shipping forecasts to help carriers plan capacity.
Work together on sustainability and innovation projects.
A strong partnership means you get priority during tight market conditions. You also gain access to new services and technology. When you invest in these relationships, you build a more resilient and efficient supply chain.
Shipping Intelligence

Industry Trends
You see rapid changes in freight procurement technology. New tools and platforms shape how you manage shipping and logistics. The market for freight procurement technology is growing fast, with revenue expected to rise from $812.5 million in 2021 to $1.39 billion by 2028. This growth comes from several key trends:
Digital freight platforms now connect shippers, carriers, and logistics providers in real time. You gain instant access to rates, capacity, and shipment status.
Automation and robotics reduce manual work and errors. Robotic process automation speeds up repetitive tasks.
Data analytics and predictive modeling help you forecast demand and make better decisions.
Artificial intelligence and machine learning optimize procurement by automating complex processes.
Blockchain technology increases transparency and security in your transactions.
IoT devices track shipments and monitor conditions, giving you better visibility across the supply chain.
Tip: Embrace these technologies to stay competitive and improve your freight procurement results.
Risk Management
You face many risks in freight procurement, from shipment delays to supplier failures. Advanced shipping intelligence tools help you manage these risks more effectively. AI-powered platforms like RISK4SEA give you predictive insights and real-time alerts about inspection risks. These tools help you prepare for inspections, identify fleet weaknesses, and benchmark performance. You can reduce vessel detentions, which lowers costs and improves customer satisfaction.
AI also supports your fleet management by optimizing routes, predicting maintenance needs, and monitoring compliance. Predictive analytics detect equipment failures before they happen, so you avoid unplanned downtime. Automation in cargo tracking and handling streamlines operations and reduces delays.
Real-time performance tracking lets you spot problems early and respond quickly.
Predictive analytics forecast disruptions and demand changes, so you can act before issues grow.
Automated supplier scorecards measure reliability and quality, guiding your choices.
Risk analysis tools highlight supply chain vulnerabilities, helping you focus on the most important threats.
Using automation and real-time data analysis, you strengthen your supply chain and make smarter, faster decisions. This approach keeps your operations resilient and your customers satisfied.
You build a strong Freight Procurement Strategy by setting clear goals, using real-time data, and forming reliable carrier partnerships. Automation helps you reduce errors and save time. Data-driven decisions improve your results. Review your current process and apply these best practices. Upgrade your tools and focus on continuous improvement. Technology gives you a long-term advantage in a changing market.
FAQ
What is the first step in building a freight procurement strategy?
You should start by assessing your current shipping process. Identify gaps, collect data, and set clear goals. This foundation helps you make informed decisions and measure progress.
How does automation improve freight procurement?
Automation reduces manual errors and speeds up tasks. You gain real-time data, faster rate comparisons, and better contract management. This leads to cost savings and improved accuracy.
Why is market knowledge important for procurement?
Market knowledge helps you understand carrier performance and rate trends. You can choose reliable partners and negotiate better rates. Staying informed keeps your business competitive.
How do you measure supplier performance?
Use key metrics like on-time delivery, defect rate, and lead time variability.
Track these regularly to spot issues early and improve supplier relationships.