What Exactly Does Logistics Analysis Analyze? A Comprehensive Breakdown from Warehouse and Transportation Perspectives!
Logistics Analysis means using data to study and improve how goods move and get stored. You can see its impact in every part of the supply chain. The logistics industry has grown quickly in recent years.
The global market reached USD 3,794.4 billion in 2023.
Experts expect it to hit USD 5,951.0 billion by 2030.
The growth rate is about 7.2% each year.
When you use Logistics Analysis, you make smarter choices in warehousing and transportation. You can organize your warehouse better, manage inventory with more accuracy, and track deliveries in real time. These steps help you work faster and serve customers well.
Key Takeaways
Logistics Analysis improves supply chain efficiency by using data to enhance warehousing and transportation processes.
Key metrics like on-time delivery and inventory accuracy help you measure performance and identify areas for improvement.
Utilizing technology such as IoT and real-time tracking can significantly reduce errors and enhance decision-making.
Building strong supplier relationships can lead to better deals and cost savings, boosting overall business performance.
Regularly reviewing key performance indicators (KPIs) ensures your logistics operations remain effective and customer-focused.
Logistics Analysis Overview
Definition and Purpose
You use Logistics Analysis to manage how resources move from suppliers to customers. This process covers how you acquire, store, and transport goods until they reach their final destination. The main goal is to make your supply chain work better. You want to improve efficiency, reduce costs, and deliver products on time. When you focus on these areas, you also help your business keep customers happy.
Here is a table that shows the main purposes of Logistics Analysis in your daily operations:
Definition of Logistics Analysis | Main Purposes in Operational Contexts |
|---|---|
Managing how resources are acquired, stored, and transported to their final destination. | Improving efficiency, reducing costs, ensuring timely deliveries, enhancing customer satisfaction. |
Core Elements
You can break down Logistics Analysis into several key parts. Each part helps you understand and improve your supply chain. The table below lists these core elements and explains what each one does:
Component | Description |
|---|---|
Planning | You coordinate logistics processes to make sure products arrive on time. |
Packaging and Unitisation | You prepare and protect products so they can be stored and shipped safely. |
Inventory Control | You track goods, predict demand, and keep the right amount of stock. |
Transportation | You manage how goods move, choose transport methods, and control costs. |
Information and Control | You use data to boost efficiency and monitor performance across all logistics activities. |
Tip: When you use technology like IoT devices and automation, you can collect real-time data and reduce mistakes. This helps you make better decisions and keep your supply chain running smoothly.
Warehousing Analysis
Key Warehouse Metrics
You can measure warehouse performance using several important metrics. These metrics help you understand how well your warehouse works and where you can improve. When you track these numbers, you make better decisions and control costs.
Here is a table showing the most commonly tracked warehouse metrics:
Metric | Description |
|---|---|
Warehouse Capacity Utilization | Measures the percentage of warehouse space that is actually used compared to total available space. |
Inventory Accuracy | Assesses the accuracy of inventory records against physical counts. |
Shipped Order Accuracy | Evaluates the accuracy of orders shipped compared to what was ordered. |
Dock to Stock | Tracks the time taken to move products from the receiving dock to storage. |
On time, in full (OTIF) | Measures the percentage of orders delivered on time and in full. |
Order processing time | The time taken from order receipt to order fulfillment. |
Inventory shrinkage rate | Monitors the loss of inventory due to theft, damage, or errors. |
Order fill rate | The percentage of customer orders that are filled completely. |
Employee turnover rate | Tracks the rate at which employees leave the organization. |
Warehouse and DC cost as a percentage of sales | Evaluates the cost of operating the warehouse relative to sales revenue. |
Total recordable incident rate (TRIR) | Measures the number of recordable incidents per 100 employees. |
Energy usage / waste carbon emissions | Assesses the environmental impact of warehouse operations. |
You also need to focus on five main areas in your warehouse:
Receiving: Track inbound volume, number of orders, and vehicle load factors. These numbers help you plan dock space and improve unloading speed.
Storage: Measure warehouse capacity utilization, inventory turnover rate, and number of SKUs. These metrics guide you in organizing storage and controlling stock levels.
Picking: Monitor picking orders, order lines, and shipment volume. You can use ABC analysis to sort items by turnover rate and place high-turnover items closer to shipping areas.
Shipping: Record shipment volumes, delivery routes, and operation times. These details help you design shipping areas and manage wave picking strategies.
Returns: Track return volumes, order counts, and processing times. Separating returns receiving from returns processing helps you manage workloads and improve efficiency.
Tip: Organizations that use warehouse metrics are much more likely to gain new customers and increase profits. Data-driven companies often outperform their competitors.
Analytical Methods
You can use several analytical methods to improve warehouse operations. These methods help you understand your data and make smart changes.
PCB Analysis: This method looks at how packaging and logistics units change from receiving to storage to shipping. You use PCB analysis to choose the right equipment and optimize storage units.
EIQ Analysis: EIQ stands for Entry count, Item count, and Quantity. You use this method to study order characteristics. You can combine EIQ with ABC analysis to group products by outbound volume or order frequency. This helps you assign storage locations more effectively.
ABC Analysis: You sort items into three groups: A-class (high turnover), B-class (medium turnover), and C-class (low turnover). Place A-class items close to shipping areas for faster picking. Count these items more often to keep inventory accurate.
Here is a list of ways these methods support your warehouse planning:
AI and machine learning help you predict demand and optimize inventory.
Advanced analytics let you manage inventory smarter and plan routes more efficiently.
Digital twin technology creates a virtual model of your warehouse. You can test different layouts and reduce risks before making changes.
Note: When you use data-driven analysis, you improve warehouse layout and resource planning. You make better choices about stock levels, equipment, and employee schedules.
Logistics Analysis gives you the tools to track performance, control costs, and design a warehouse that meets your business needs. You can use these metrics and methods to build a more efficient and reliable operation.
Transportation Analysis

Transportation plays a key role in your supply chain. When you analyze transportation, you look at how goods move from your warehouse to your customers. You want to make sure shipments arrive on time, stay safe, and cost as little as possible. Good transportation analysis helps you spot problems, control spending, and keep your customers happy.
Transportation Metrics
You can measure transportation performance with several important metrics. These numbers show how well your delivery process works and where you can improve.
Metric | Benchmark Value |
|---|---|
On-Time Delivery Rate (OTD) | |
Freight Cost per Unit | Standardized cost per unit shipped |
Damage or Loss Rate |
On-Time Delivery Rate (OTD): This shows the percentage of shipments that reach customers when promised. A rate of 95% or higher is the industry standard. High OTD means your deliveries are reliable.
Freight Cost per Unit: This tells you how much it costs to ship each item. You want this number to be as low as possible without hurting service quality.
Damage or Loss Rate: This measures the percentage of shipments that arrive damaged or do not arrive at all. Lower rates mean better handling and safer deliveries.
Tip: Tracking these metrics helps you find weak spots in your delivery process. You can then fix problems before they affect your customers.
Real-time tracking technology gives you a big advantage. You can watch shipments as they move, get updates, and spot delays right away. This helps you act fast if something goes wrong. Real-time tracking also lets you reroute shipments or adjust inventory to avoid bigger issues. When you use these tools, you improve teamwork and keep everyone informed.
Cost and Performance Analysis
You need to understand both direct and indirect costs in transportation. Direct costs include things like freight charges, fuel, driver wages, and vehicle leasing. Indirect costs cover administrative expenses, technology, and risk management.
Cost Type | Examples |
|---|---|
Direct Costs | Freight charges, fuel costs, driver wages, vehicle leasing or depreciation |
Indirect Costs | Administrative expenses, technology costs, risk management costs |
To analyze these costs, you should:
List all expenses related to transportation.
Set clear key performance indicators (KPIs).
Collect data on each cost.
Calculate both direct and indirect costs.
Compare your numbers to industry standards.
When you track costs and performance, you see how well your transportation system works. You can spot areas where you spend too much or where service falls short. This helps you make smart choices to save money and improve service.
Note: Real-time insights help you find bottlenecks and reduce risks. You can prevent disruptions and keep your supply chain strong.
Transportation analysis also affects your customers. High on-time delivery rates show that you are reliable. Customers trust you more when their orders arrive as promised. Regularly checking your KPIs helps you keep improving. Reliable service means fewer complaints and more repeat business.
Here is how transportation cost and performance analysis impacts customer experience:
You measure costs, time, and service quality with transportation KPIs.
High on-time delivery rates show you are dependable, which makes customers happy.
Regular monitoring helps you keep your service reliable.
Reliability is key. When your deliveries are consistent, customers know what to expect. This builds trust and sets you apart from competitors.
Remember: Logistics Analysis gives you the tools to track, measure, and improve every part of your transportation process. When you use these insights, you create a supply chain that is efficient, cost-effective, and customer-focused.
Key Metrics and KPIs
Common Logistics KPIs
When you want to measure how well your supply chain works, you need to track the right key performance indicators (KPIs). These KPIs help you see what is working and what needs to change. Here are some of the most widely used logistics KPIs across different industries:
On-time delivery
Cost per shipment
Appointment scheduling compliance
Freight tracking compliance
On-time pick-up
Cost per pallet
Sustainability KPIs
Cost per pound
Primary tender acceptance
You should choose KPIs that match your business goals. For example, if you want to improve delivery speed, focus on on-time delivery and on-time pick-up. If you care about costs, track cost per shipment or cost per pallet. Sustainability KPIs help you measure your impact on the environment.
Tip: Focusing on a few important KPIs gives you a clear picture of your logistics performance without overwhelming your team.
Data Analysis Techniques
To get the most value from your KPIs, you need a smart approach. Here is a simple process you can follow:
Define your business objectives so your KPIs stay relevant.
Select a mix of leading and lagging indicators for a full view of performance.
Limit your KPIs to 3-5 per objective to keep your focus sharp.
Assign clear ownership for each KPI to make sure someone is responsible.
Use centralized tracking tools for real-time monitoring.
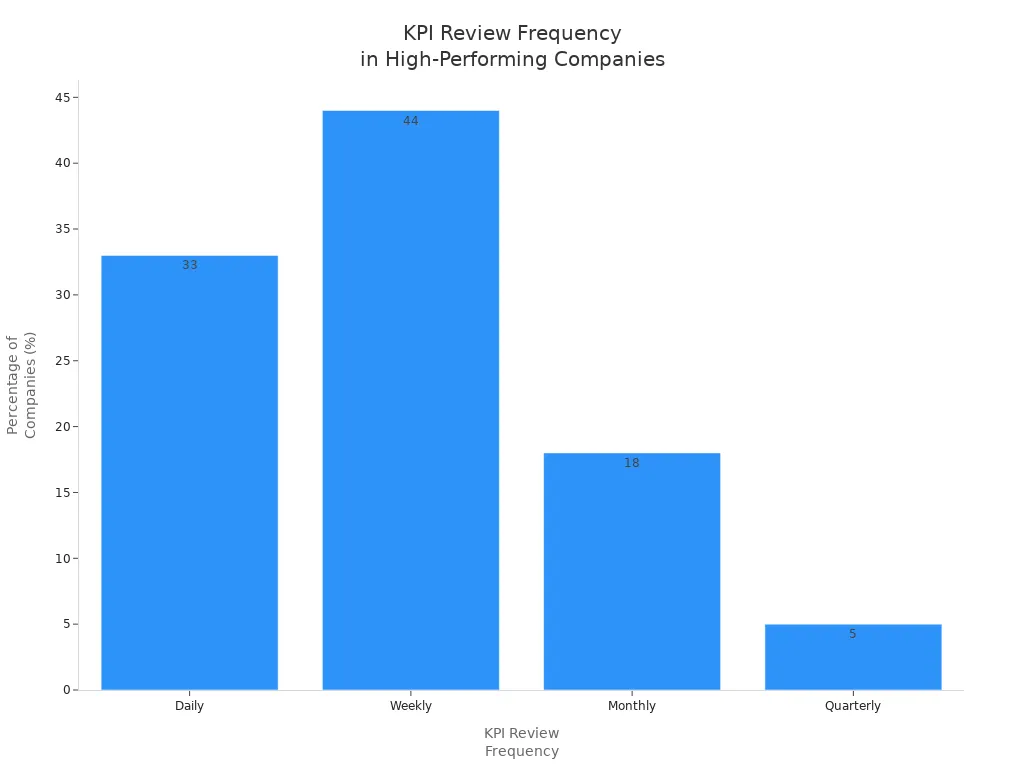
Schedule regular reviews to adjust KPIs as your business changes.
KPI Review Frequency | % of High-Performing Companies |
|---|---|
Daily | 33% |
Weekly | 44% |
Monthly | 18% |
Quarterly | 5% |
Advanced analytics tools, such as machine learning and predictive modeling, make your Logistics Analysis even stronger. These tools help you make decisions faster, use resources better, and predict demand more accurately. You can also spot risks early and avoid problems before they grow.
Note: When you use data analysis and the right KPIs, you build a supply chain that is efficient, reliable, and ready for the future.
Business Impact of Logistics Analysis
Efficiency and Cost Reduction
When you use Logistics Analysis, you can see real changes in how your business runs. You make your supply chain faster and save money at the same time. Many companies notice that efficient inbound logistics help lower storage costs and make the whole supply chain more flexible. You also get better deals from suppliers when you build strong relationships, which leads to more savings.
Here are some ways companies have improved efficiency and cut costs:
Efficient inbound logistics reduce storage costs and boost supply chain agility.
Strong supplier relationships help you negotiate better terms and save money.
Some businesses have saved up to 7% of their EBITDA by using Logistics Analysis.
One client saw a return that was ten times their investment in logistics services.
Innovation and energy sustainability drive efficiency and support economic growth.
You can measure the return on your investment in several ways. The table below shows common methods:
Methodology | Description |
|---|---|
Payback Period Analysis | Calculates the time for the investment to pay for itself through cost savings or increased revenue. A shorter payback period indicates a more favorable investment. |
Advanced Analytics | Uses simulation models to predict the impact of technology investments on operations, providing a nuanced understanding of potential ROI. |
Total Cost of Ownership (TCO) | Captures all associated costs of an investment, allowing for a comprehensive analysis against improvements in operational metrics. |
Tip: When you track your costs and use data, you can quickly see where you save money and where you can do better.
Customer Satisfaction
Logistics Analysis does more than save money. It helps you keep your customers happy. Studies show a strong link between logistics service quality and customer satisfaction. When you improve your operations and respond quickly, your customer satisfaction scores go up.
You can see these benefits in your daily work:
Better logistics service quality leads to higher customer satisfaction.
Fast and reliable order fulfillment makes customers want to buy from you again.
Companies that use Logistics Analysis can adapt quickly to market changes, which keeps customers happy.
Technology and data analytics help you shorten order cycle times and deliver on time.
Note: When you use Logistics Analysis to improve delivery reliability and speed, you build trust with your customers and encourage them to return.
Logistics Analysis gives you the power to transform your supply chain. You can see real business value, as shown in recent case studies:
Business Challenge | Solution | Business Value |
|---|---|---|
High outbound costs | Shipping methods optimized | |
Needed better transportation management | Centralized carrier bids | Saved $5 million in three years |
When you use data-driven tools like IoT and AI, you gain real-time visibility, optimize routes, and respond quickly to changes. Apply these strategies to keep improving your operations and stay ahead in the market.
FAQ
What is the main goal of logistics analysis?
You use logistics analysis to make your supply chain work better. It helps you find problems, cut costs, and deliver products on time. You can use data to make smart decisions and improve your business.
How do you measure warehouse efficiency?
You track key metrics like space usage, order accuracy, and inventory turnover. These numbers show how well your warehouse works. You can use them to spot issues and plan improvements.
Why is real-time tracking important in transportation?
Real-time tracking lets you see where your shipments are at any moment. You can react quickly to delays or problems. This helps you keep customers happy and avoid extra costs.
Which KPIs matter most in logistics?
On-time delivery rate
Cost per shipment
Inventory accuracy
You should pick KPIs that match your business goals. These numbers help you measure success and find ways to improve.
See Also
Revolutionizing Logistics Efficiency With JUSDA's Smart Solutions
Unlocking Supply Chain Efficiency: Expert Tips for Savings
Achieving Success in High-Tech Manufacturing Through Lean Logistics
The Comprehensive Guide to Reducing Logistics Costs Effectively
Boosting Warehouse Productivity With Advanced Logistics Robotics