Ocean Freight Rate Fluctuations in the Second Half of 2025
Ocean Freight Rate trends show clear signs of cooling as supply outpaces demand in 2025. The early arrival of the peak season, driven by frontloading before new tariffs, caused a surge in shipments and a quick drop in demand.
Indicator | Statistic | Effect on Rates |
|---|---|---|
Vessel Capacity Growth | Downward pressure on rates | |
Cargo Demand Growth | 3% increase | Rate decline as supply exceeds demand |
Blank Sailings | 25%+ canceled loops | Carrier effort to stabilize rates |
Ongoing volatility from tariffs, capacity shifts, and geopolitical risks demands proactive planning and risk management from shippers.
Key Takeaways
Ocean freight rates are cooling in 2025 because shipping capacity is growing faster than demand, leading to lower prices.
The early peak season caused a temporary spike in rates as shippers rushed to avoid new tariffs, but rates began to ease afterward.
Shippers face rising costs and reliability challenges due to factors like port congestion, labor issues, and geopolitical risks.
Using smart booking strategies, modal flexibility, and strong partnerships helps shippers manage rate volatility and supply chain risks.
Expect ongoing rate fluctuations through late 2025, with possible short-term spikes but a general downward trend as capacity increases.
Ocean Freight Rate Trends
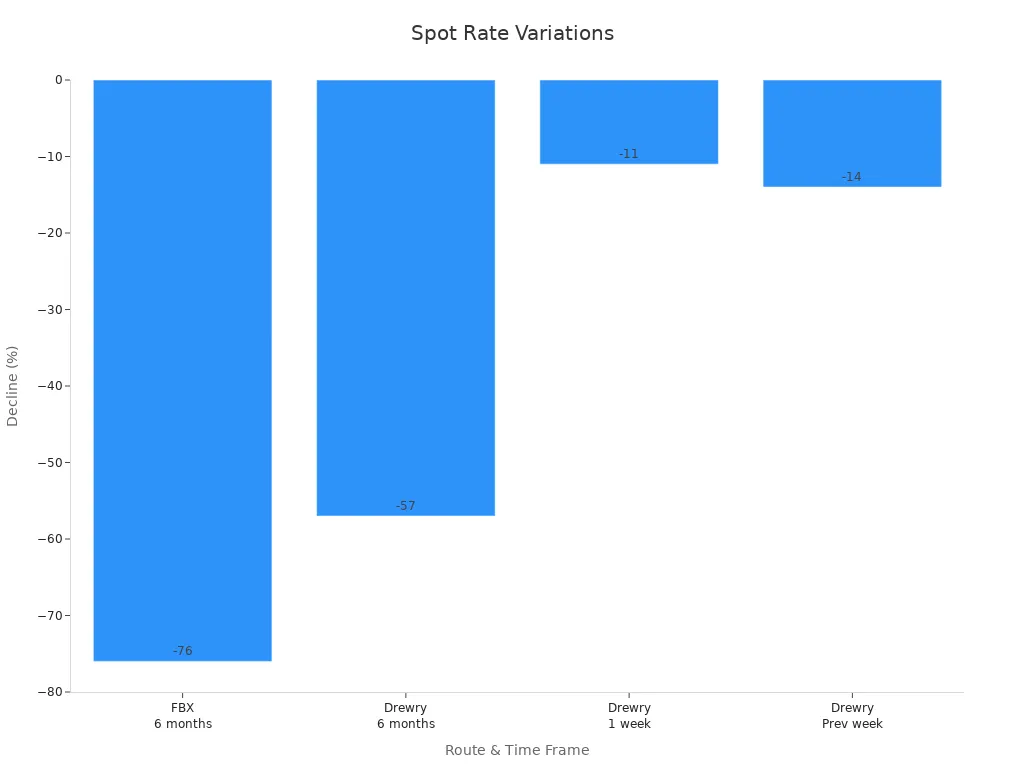
Spot Rate Movements
Ocean Freight Rate movements in 2025 reflect a cooling market as supply outpaces demand. Major indices, such as the Drewry World Container Index (WCI), Freightos Baltic Index (FBX), and Xeneta, track these changes across global trade lanes. The WCI composite rate stands at about $2,836 per 40-foot container, which is nearly double the pre-pandemic average but shows a 66% year-over-year increase. However, recent weeks have seen spot rates decline slightly, signaling a shift toward normalization.
Industry data highlights the following trends:
In the first quarter of 2025, spot rates traded at a 5% to 8% discount compared to contract rates. This pattern indicates a muted spot market and places pressure on carriers.
Spot rates briefly surpassed contract rates in late 2024 but returned to discounts in early 2025.
The average spot rate from the Far East to the US East Coast hovered around $7,000 per FEU in October 2024, while North Europe to US East Coast rates increased by 50% since August but remained at $2,800 per FEU.
The persistence of low spot and contract rates signals a cooling environment for the Ocean Freight Rate market.
Key indices reinforce these observations:
Route | Index | Change (%) | Current Rate (per 40ft) |
|---|---|---|---|
Asia-North America | Drewry WCI | -5% week-on-week | $6,934 |
Asia-North America | Xeneta Transpacific XSI | -6% week-on-week | $7,322 |
Asia-North America | Freightos FBX | -4% week-on-week | $7,738 |
Asia-North Europe | Drewry WCI | Flat | $8,260 |
Asia-North Europe | Xeneta XSI | Flat | $8,474 |
Asia-North Europe | Freightos FBX | -2% week-on-week | $8,420 |
The Freightos Baltic Index provides daily, real-time insights into Ocean Freight Rate changes, offering shippers and carriers a clear view of market direction. These indices, along with platforms like Xeneta, aggregate millions of data points to ensure transparency and accuracy in rate tracking.
Early Peak Season Effects
The early arrival of the 2025 peak season created significant shifts in Ocean Freight Rate patterns. Shippers rushed to move cargo ahead of new tariff deadlines, leading to a surge in bookings and frontloading of shipments. This activity caused a temporary spike in rates, especially on trans-Pacific routes.
Statistical data shows the impact of this early peak:
Statistic Description | Value/Change | Explanation |
|---|---|---|
Trans-Pacific container rates (Asia to U.S. West Coast) | Over $6,000 per FEU (spot rates) | Rates doubled compared to earlier periods, reflecting early peak demand and frontloading |
Trans-Pacific container rates (Asia to U.S. East Coast) | Exceeding $7,000 per FEU | 60% increase, mirroring last year's peak levels due to early peak season and tariff-driven frontloading |
Projected peak season volume in July vs. last year's August peak | 9% lower | Frontloading pulled volumes forward, reducing peak season volume later in the season |
Projected peak season volume in July vs. April levels | 4% lower | Reflects strong frontloading in April ahead of tariff deadlines |
Asia-Mediterranean rates increase | 32% increase to $4,285 per FEU | Ripple effect of frontloading and capacity shifts to trans-Pacific routes |
Anticipated General Rate Increases (GRIs) | $1,000 to $3,000 per FEU in mid-June and July | Carriers responding to capacity constraints and port congestion |
Rate trend after early June surge | Expected easing by mid-July | Due to cooling demand, increased capacity, and reduced congestion |
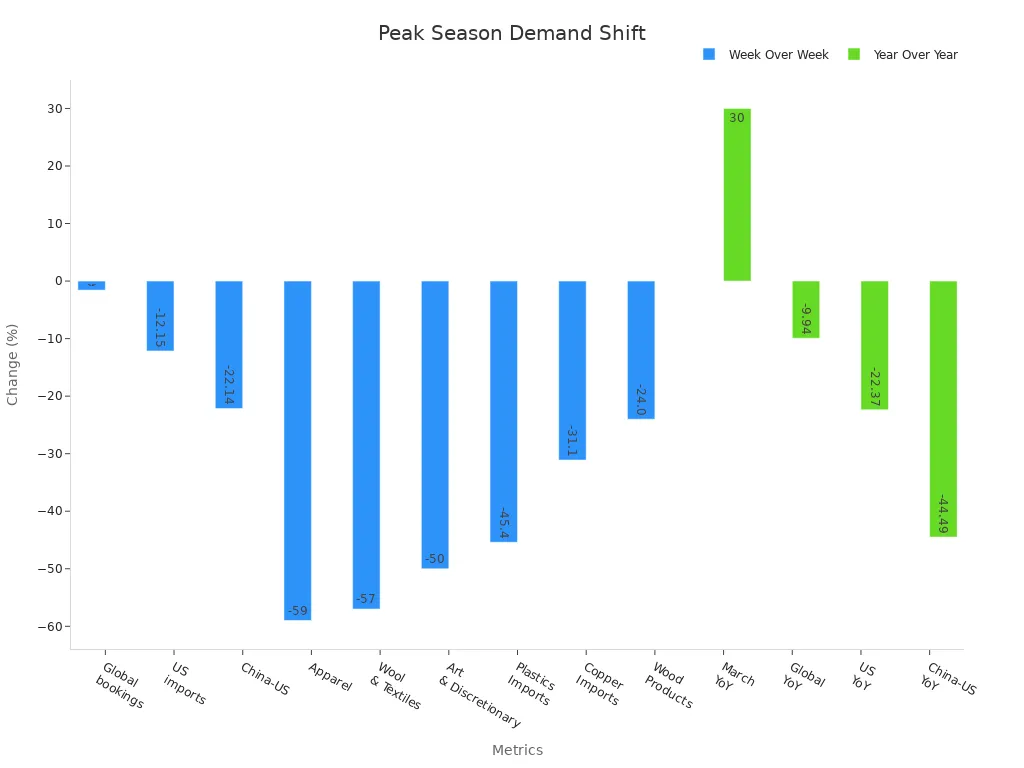
Booking data further illustrates the volatility:
Metric / Trade Lane | Week-over-Week Change (%) | Year-over-Year Change (%) | Timeframe / Context |
|---|---|---|---|
Global bookings | +29.6% | -21.2% | Early May rebound after April slump |
U.S. imports | +40.3% | -30.3% | Recovery but still below 2024 levels |
China to U.S. imports | +70.6% | -61.5% | Largest weekly gain but historically low |
China to U.S. daily bookings | +108.6% (May 9 to May 16) | N/A | Sharp surge after tariff pause announcement |
Note: The early peak season led to a sharp, temporary increase in Ocean Freight Rate levels, but as frontloaded cargo cleared, demand softened and rates began to ease. Carriers responded with blank sailings and capacity adjustments to stabilize the market.
These trends highlight the importance of monitoring Ocean Freight Rate movements and understanding how external factors, such as tariffs and frontloading, can create short-term volatility followed by rapid normalization.
Market Drivers
Demand Shifts
Demand for ocean freight changes quickly in response to global events and trade policies. The Sea Freight Container Price Index tracks these changes, reflecting how supply and demand, fuel prices, and economic conditions affect rates. When shippers rushed to move goods before new tariffs in early June 2025, rates spiked. As demand cooled and carriers added more capacity, rates dropped. The table below shows how these shifts impacted major trade lanes:
Route / Index | Time Period | Rate Change / Trend | Explanation / Demand Influence |
|---|---|---|---|
Freightos Baltic Index (global) | Early June 2025 | Surge due to transpacific frontloading ahead of tariff increase | |
Freightos Baltic Index (global) | Mid to late June 2025 | -22% drop to $2,894/FEU | Demand cooled and carriers increased capacity |
Asia to N. America West Coast | Late May to mid-June | +115% increase to ~$6,000/FEU | Tariff-driven demand surge |
Asia to N. America West Coast | Mid to end June | -43% drop to $3,388/FEU | Demand easing and excess capacity |
Asia to N. America East Coast | Mid-June | +80% increase to ~$7,200/FEU | Tariff-driven demand surge |
Asia to N. America East Coast | End of June | -15% drop to $6,116/FEU | Demand easing but still +54% month-on-month increase |
Capacity Growth
Carriers continue to add new vessels, increasing global shipping capacity by about 8% in 2025. Demand, however, grows only 3%. This gap creates oversupply, which puts downward pressure on rates. Carriers respond by canceling sailings or removing ships from service to balance the market. Larger, more efficient vessels help reduce costs and meet environmental rules, but operational issues like port congestion still limit full use of the fleet.
Carriers use blank sailings and service suspensions to manage excess capacity.
Investments in new vessels improve efficiency but add to volatility.
Geopolitical Factors
Geopolitical events shape ocean freight rates through their impact on oil prices and trade flows. Conflicts and sanctions disrupt shipping routes, while uncertainty increases fuel costs. The Baltic Dry Index often reacts to these changes. For example:
Geopolitical risk raises oil prices, which then drive up freight rates.
Shipping volumes fall during periods of high geopolitical tension, especially for sea freight.
The link between oil prices and freight rates becomes stronger when risks are high.
Regulatory Changes
Regulatory shifts, such as new trade agreements or changes in shipping alliances, also influence rates. The end of major shipping alliances in Europe by 2025 increases market competition and volatility. Regional trade deals lower tariffs and encourage more predictable rates. During the COVID-19 pandemic, regulatory responses led to sharp swings in the Baltic Dry Index, showing how sensitive rates are to policy changes. Monitoring these developments helps shippers manage costs and plan ahead.
Shipper Impact
Cost Pressures
Shippers face growing cost pressures in the current ocean freight market. Operational expenses for U.S. carriers have risen sharply. Driver wages and benefits increased by 30% from 2019 to 2023. Equipment costs climbed by 41%, while maintenance and insurance costs grew by 36% and 39%, respectively. In Less than Truckload (LTL) shipping, accessorial charges now appear on nearly 40% of invoices, up from just 10% in 2014. These charges have grown from 3% to 14% of linehaul costs, making them a significant burden. Shippers also feel the impact of excess vessel capacity and tariff adjustments. The reduction of U.S. tariffs on Chinese goods has not offset the extra capacity added since May, leading to continued rate declines. Cross-border shipping adds further complexity, with tariffs and economic uncertainty in neighboring countries affecting freight volumes and costs. To manage these pressures, shippers use strategies such as negotiating accessorials, selecting carriers carefully, and leveraging technology for efficiency.
Service Reliability
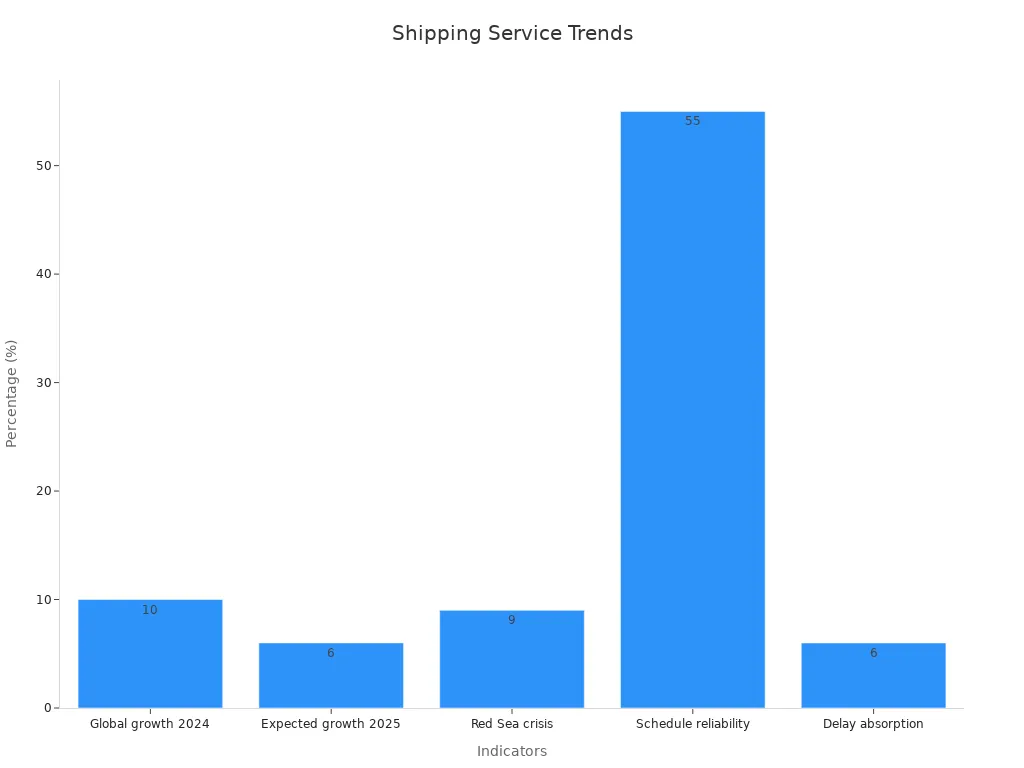
Service reliability remains a key concern for shippers. Industry experts expect gradual improvement in 2025, supported by new alliances and increased vessel capacity. The Gemini Alliance between Maersk and Hapag-Lloyd aims for 90% reliability with a 21-day transit time, a notable goal compared to current levels below 55%. However, disruptions like port congestion and geopolitical tensions continue to challenge reliability. In 2024, schedule reliability fluctuated between 50% and 60%. The Red Sea crisis forced many vessels to reroute, causing reliability to drop and average late arrivals to reach 5.67 days. Despite a 10% increase in the global container fleet in 2024 and another 6% expected in 2025, effective capacity remains constrained by delays, maintenance, and compliance requirements.
Risk Factors
Shippers must navigate a complex risk environment. Global shipping demand rose by 7.1% in 2024, while supply expanded by 10.5%. This imbalance, combined with ongoing geopolitical tensions and route disruptions, keeps freight rates volatile. Fuel costs account for up to half of total operating expenses, and port charges represent another 20-25%. Spot rates on major trade routes increased by as much as 30% in early 2024. The Logistics Managers’ Index shows that capacity constraints continue to support high freight costs. Risk indices help shippers benchmark and evaluate threats, including infrastructure weaknesses and regulatory changes. These factors highlight the need for careful planning and risk management in ocean freight logistics.
Managing Volatility
Booking Strategies
Shippers face unpredictable ocean freight rates in 2025. They must use smart booking strategies to manage costs and avoid disruptions. Early bookings help secure space during peak periods. Flexible contracts allow shippers to adjust volumes as market conditions change. Many companies now use digital platforms to compare rates and track shipments in real time. These tools give shippers more control and help them respond quickly to sudden changes. Carriers often offer incentives for long-term commitments, which can lock in favorable rates and reduce exposure to market swings. Shippers who diversify their carrier base also gain more options if one route faces delays or congestion.
Modal Flexibility
Modal flexibility gives companies a powerful way to handle risk in ocean freight shipping. By combining different transport modes—such as sea, air, rail, and road—shippers can keep goods moving even when one mode faces disruption. The benefits include:
Multimodal transportation spreads risk across modes, lowering insurance costs and shipment risk.
During the Red Sea crisis, combining sea and air transport reduced transit times and avoided delays from longer ocean routes.
Built-in redundancy allows companies to switch modes if one becomes unavailable, minimizing delays and keeping supply chains running.
Multimodal transport supports sustainability goals by using greener modes like rail and sea, which can cut emissions by up to 80% compared to road transport.
Technology and logistics software provide real-time tracking and better visibility, reducing blind spots.
A recent comparison showed that switching from the traditional Dubai sea-air route to a Los Angeles sea-air route during the Red Sea crisis saved 17% in costs and cut transit time by two days. This example highlights how modal flexibility can improve both resilience and efficiency.
Partnerships
Strategic partnerships play a key role in managing volatility. Companies that build strong relationships with suppliers and carriers gain better visibility and faster access to critical information. For example, when Taiwan faced a severe drought in 2021, the resulting microchip shortage affected car makers worldwide. Companies with close supplier partnerships could identify risks early and adjust their plans. Collaboration between shippers and carriers also supports joint planning and risk mitigation. Investments in supplier development and digital tools, such as supply chain digital twins, help companies find alternative suppliers and adapt quickly to disruptions. These partnerships foster trust, open dialogue, and shared goals, making the entire supply chain more resilient.
Ocean Freight Rate Outlook
Forecast for Late 2025
Industry experts expect the Ocean Freight Rate to remain volatile through late 2025. Demand for ocean shipping is projected to grow by about 3%. However, new vessels entering service will increase capacity at a faster pace. This oversupply could push rates downward, especially if global economic growth does not keep up. The reopening of key transit routes, such as the Suez Canal after Red Sea disruptions, may add even more capacity to the market. If demand stays soft, shippers could see lower rates and more choices for routing cargo.
Labor negotiations, especially with the International Longshoremen’s Association on the U.S. East and Gulf coasts, present a major risk. Strikes or work slowdowns could disrupt supply chains and cause temporary spikes in the Ocean Freight Rate. Carriers may also respond to market shifts by adjusting schedules or canceling sailings to stabilize prices. Most forecasts suggest a period of elevated but unstable rates, with short-term increases possible before tariff deadlines or during labor disputes.
Note: Temporary rate spikes may occur before new tariffs or during labor actions, but oversupply is likely to drive rates lower once these events pass.
Key Uncertainties
Several factors could change the outlook for ocean freight in late 2025:
Inflation remains close to the Federal Reserve’s target, but interest rates are still high, creating uncertainty for shippers.
Tariff threats and trade tensions continue to affect equipment costs and market confidence.
Labor negotiations on the U.S. East and Gulf coasts could lead to strikes, disrupting port operations and raising rates.
Freight shipment volumes have declined, with the Cass Freight Index showing a 3.6% drop year-over-year.
Small business optimism is falling, with many companies reducing hiring and investment.
Global supply chain disruptions, such as those caused by geopolitical events or natural disasters, can quickly change capacity and pricing.
These uncertainties highlight the need for flexible planning and close monitoring of the Ocean Freight Rate. Shippers who adapt quickly to changing conditions will be better positioned to manage costs and maintain reliable supply chains.
The Ocean Freight Rate outlook for late 2025 points to ongoing volatility and a likely downward trend as capacity growth outpaces demand. Businesses can strengthen their supply chains by following these steps:
Diversify shipping routes and suppliers.
Use digital freight monitoring tools.
Optimize packaging and cargo consolidation.
Staying alert to market drivers and adapting strategies will help companies manage costs and maintain resilience.
FAQ
What causes ocean freight rates to change so often?
Ocean freight rates change due to supply and demand, new vessel deliveries, and global events. Tariffs, port congestion, and geopolitical risks also play a role. Carriers adjust capacity to stabilize prices.
How can shippers manage unpredictable freight costs?
Shippers can secure long-term contracts, use digital rate tracking tools, and diversify shipping routes. Early bookings and flexible contracts help reduce risk. Strong partnerships with carriers improve reliability.
Will ocean freight rates stay high for the rest of 2025?
Most experts expect rates to trend downward as new vessels increase capacity. Short-term spikes may occur before tariff deadlines or during labor disputes. Oversupply will likely keep rates from rising long-term.
What risks should shippers watch in late 2025?
Shippers should monitor labor negotiations, tariff changes, and geopolitical events. Port congestion and fuel price swings can also disrupt schedules. Staying informed helps companies adapt quickly.
Do digital platforms help with ocean freight planning?
Digital platforms provide real-time rate data, booking options, and shipment tracking. These tools help shippers compare prices, secure space, and respond to market changes faster.
See Also
Discover The Latest Innovations In Sea Freight Logistics
Understanding Emerging Trends In Logistics Risk Management
In-Depth Insights Into The Future Of LTL Freight
Top Five Trends Shaping Supply Chain Efficiency Ahead
How Artificial Intelligence Is Transforming Supply Chain Logistics