Ocean Shipping Costs: Trends and Projections for Late 2025
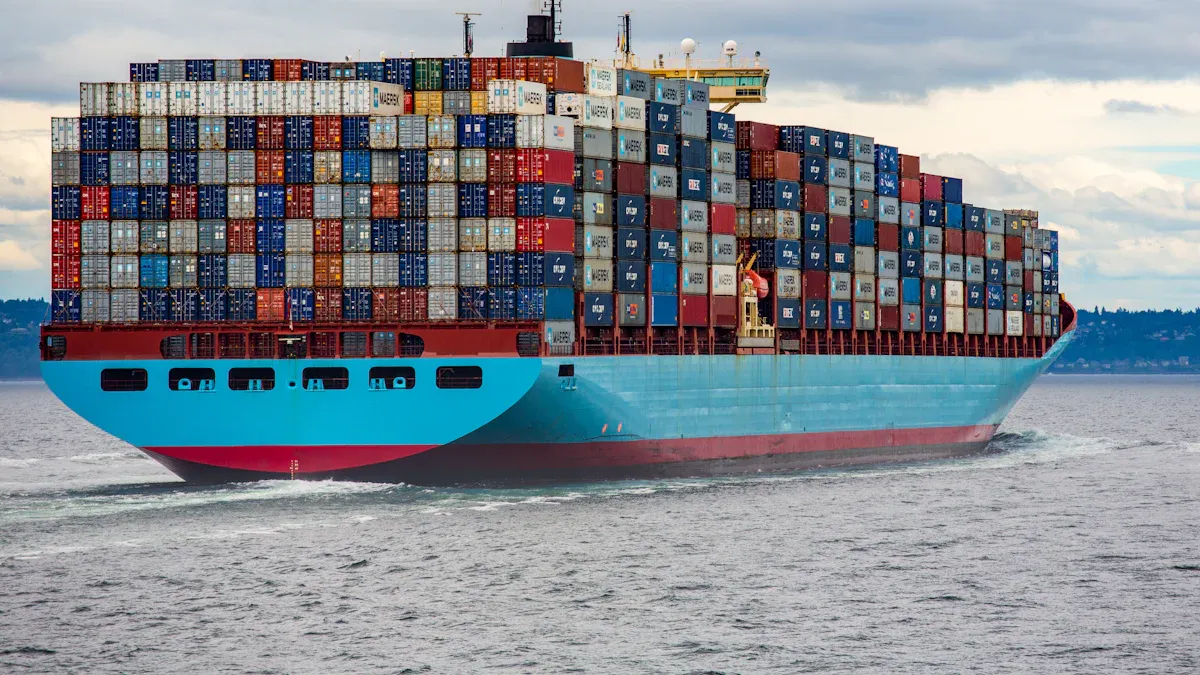
Late 2025 brings uncertainty to global shipping, with ocean shipping costs remaining volatile due to global tensions, labor actions, and shifting demand. Recent data shows:
Asia to US West Coast and Europe ocean shipping costs tripled from late 2023 to early 2024, peaking near $5,000–$5,500 per FEU.
By spring 2024, ocean shipping costs settled at $3,000 per FEU, still double the historical average.
Peak season in July 2024 saw ocean shipping costs surge past $8,000 per FEU due to frontloading and labor concerns.
Shippers face a landscape where preparation and quick adaptation to ocean shipping costs matter more than ever.
Key Takeaways
Ocean shipping costs will stay unstable through late 2025 due to global events, changing demand, and new regulations.
Shipping delays and higher costs often come from disruptions like the Red Sea crisis, port congestion, and labor strikes.
Expanding fleet capacity and new technology may help lower costs, but rising fuel and compliance expenses keep prices high.
Shippers can save money by booking early, using alternative routes, diversifying suppliers, and staying flexible to market changes.
Monitoring news, tariffs, and market trends helps companies adapt quickly and avoid costly surprises in shipping expenses.
Trends & Projections
Rate Outlook
Ocean shipping costs in late 2025 are expected to remain volatile. Several factors drive this outlook, including shifting demand, capacity changes, and ongoing geopolitical disruptions. Recent data shows that freight rates can swing sharply in response to global events. For example, from January to June 2024, ocean freight rates increased by 36% to 41% month-over-month, doubling within six months. These spikes often result from crises like the Red Sea conflict, which forces vessels to reroute, increasing both transit times and operational costs.
A Shipping Sentiment Index, built from over 9,000 shipping news headlines, closely tracks these rate changes. The index shows that market sentiment and economic policy uncertainty, especially in China, can quickly push rates higher. Statistical sources confirm that late 2025 could see percentage increases on major trade routes such as Asia-Europe (+11%), Transpacific (+18%), and Transatlantic (+9%). However, analysts also forecast a 15-17% decrease in average global freight rates year-over-year, due to new vessel deliveries and some weakening demand in certain lanes.
Tip: Strategic shippers who align closely with carriers and optimize their logistics can reduce freight costs by up to 15%, even in volatile markets.
Indicator / Forecast | Value / Range | Explanation / Implication |
|---|---|---|
Global seaborne trade growth | 2.0% to 3.0% | Steady expansion supports cost trends. |
Container volume growth | 3.0% to 4.0% | Rising demand impacts capacity and costs. |
Freight rate potential peak | Up to $20,000 per container | Approaching COVID-era peaks, showing volatility. |
Year-over-year average global freight rate change | Increased fleet capacity and declining demand in some lanes. | |
Freight cost reduction for strategic shippers | Up to 15% | Achievable through carrier alignment and logistics optimization. |
New port fees for Chinese-built vessels | $120 per container | Additional cost factor from October 2025. |
Trade Lane Shifts
Trade lane dynamics continue to shift as carriers respond to disruptions and changing demand. The ongoing Red Sea crisis has forced many vessels to reroute around the Cape of Good Hope, adding days to transit times and increasing costs. In the first nine months of 2024, container volumes reached 1.6 million TEU, a 14.8% increase over the previous year. Offered capacity also surged, with averages in early October 2024 up 73% compared to the same period in 2023.
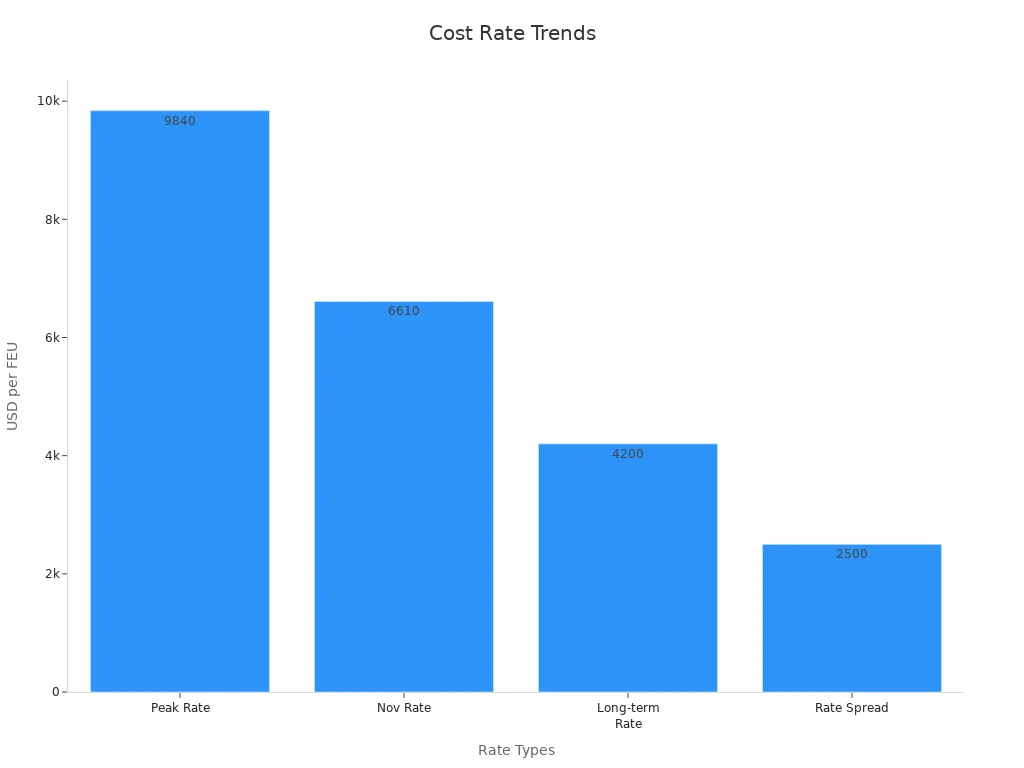
However, reliability has suffered. Schedule reliability dropped to 19.5% on-time arrivals in September 2024, the lowest ever recorded. Promised transit times averaged 38 days, but actual transit times stretched to 47 days in the third quarter of 2024. Spot rates peaked at $9,840 per FEU in July 2024, then fell to $6,610 by November, still 80.7% higher than the previous year. Long-term contract rates also increased by 84.6% to $4,200 per FEU.
Note: Seasonal factors, such as peak shipping periods and factory shutdowns during Chinese New Year, will continue to cause rate variability across trade lanes.
Capacity Changes
Fleet capacity is expanding rapidly, which could put downward pressure on ocean shipping costs in some regions. The global merchant fleet grew by 6.5% in 2023, with container ship capacity up 19%. Newbuilding deliveries reached 16.8 million gross tons in 2023, a 26% increase from the previous year. The orderbook for new ships nearly doubled from 2019 to 2023, and scheduled deliveries for 2024 and 2025 remain high.
Aspect | Evidence Summary |
|---|---|
2023 Fleet Growth | China-owned merchant fleet grew 6.5% in 2023, with container ship capacity up 19%. |
Newbuilding Deliveries | 16.8 million gross tons delivered in 2023, a 26% increase from previous year. |
Orderbook Growth | Orderbook rose from 18.8m gt in 2019 to 35.7m gt in 2023 (90% increase over 4 years). |
Scheduled Deliveries | 14.1m gt scheduled for 2024, 10.8m gt for 2025, indicating continued capacity expansion. |
Despite this growth, cost inflation in shipbuilding and new environmental regulations could offset some of the downward pressure on rates. Battery electric ships are becoming more cost-effective, especially as carbon pricing rises. By 2035, up to 80% of certain battery electric vessels may reach cost parity with traditional ships, signaling a shift in fleet composition and operating costs.
The combination of new vessel deliveries, evolving technology, and regulatory changes will shape the cost landscape for ocean shipping through late 2025 and beyond.
Ocean Shipping Costs Drivers
Supply & Demand
Supply and demand play a central role in shaping ocean shipping costs. When demand rises, especially during peak seasons or after disruptions, rates often surge. Carriers face higher expenses from fuel, port charges, and other operational costs. The table below highlights key factors and recent market data:
Factor Category | Specific Factor | Numerical Evidence |
|---|---|---|
Supply Factors | Fuel Cost | |
Supply Factors | Port Charges | 20-25% of operational expenditures |
Demand Factors | Spot Rate Increase (Far East to North Europe) | 30% increase (Apr-May 2024) |
Demand Factors | Spot Rate Increase (Far East to U.S. West Coast) | 29% increase (Apr-May 2024) |
Market Size | Global Ocean Freight Market (2023) | $75.8 billion |
Market Growth | CAGR (2024-2030) | 4.8% |
Pricing Growth Outlook | Annual Pricing Growth | 10-22% annually |
Capacity crunches, weather, and route disruptions can also push rates higher. Carriers often adjust their strategies by evaluating container availability, equipment, and route coverage.
Geopolitics
Political events and conflicts can cause sudden changes in ocean shipping costs.
Geopolitical tensions disrupt trade routes, forcing ships to take longer journeys and use more fuel.
Tariffs and trade barriers add extra expenses that carriers pass on to customers.
Sanctions or embargoes create delays and increase idle time costs.
Insurance premiums rise for ships in high-risk zones.
The 2021 Suez Canal blockage and the Russia-Ukraine conflict both forced rerouting, increasing journey lengths and costs.
During the 2024 Red Sea conflict, shipping costs for 5,000 FEU containers from the Far East to the US West Coast jumped from $10.4 million in August 2023 to $25.67 million by Q3 2024.
These examples show how quickly political events can reshape shipping patterns and expenses.
Regulations
New regulations have a direct impact on ocean shipping costs. Authorities now require more transparency and fair practices. The table below summarizes recent regulatory changes and their effects:
Evidence Type | Description |
|---|---|
Detention and Demurrage Increase | 104% rise in charges at top 20 ports (2020-2021) |
Demurrage Fees Paid | $43.03 million at LA and Long Beach ports |
Rate Increases | 250% to West Coast, 170% to East Coast |
OSRA Invoice Data Requirements | 13 data elements now required for transparency |
FMC Budget Increase | $32.9M (2022) to $49.2M (2025) for better enforcement |
These measures aim to limit unfair fees and improve supply chain visibility, but they also add compliance costs for carriers.
Technology
Technology is transforming the shipping industry and influencing ocean shipping costs.
Digital tools like IoT, AI, and blockchain help optimize routes, monitor emissions, and improve maintenance.
Predictive maintenance and bunker fuel optimization lower operational costs.
Methanol-fueled vessels can cut greenhouse gas emissions by 60% compared to traditional fuels.
LNG and fuel cell systems offer further emission reductions and cost savings, though they require high initial investments.
E-commerce growth drives demand for digital logistics and faster shipping.
Technology adoption helps carriers manage costs and meet new environmental standards, but investment levels remain low across the industry.
Market Disruptions
Red Sea Impact
Disruptions in the Red Sea have caused major changes in global shipping. Since October 2023, attacks and instability forced ships to avoid the Suez Canal and travel around the Cape of Good Hope. This detour added about 3,500 nautical miles and at least 14 days to each voyage. As a result, shipping times increased and fuel costs soared. The Shanghai Containerized Freight Index jumped from $707 per TEU in November 2023 to $3,103 per TEU by January 2024. This more than 200% rise shows how quickly rates can change. The China Containerized Freight Index also climbed 120% from October 2023 to June 2024. These changes led to higher costs for shippers and less reliable schedules.
Aspect | Details |
|---|---|
Disruption Location | Red Sea (starting October 2023) |
Global Freight Rate Increase | |
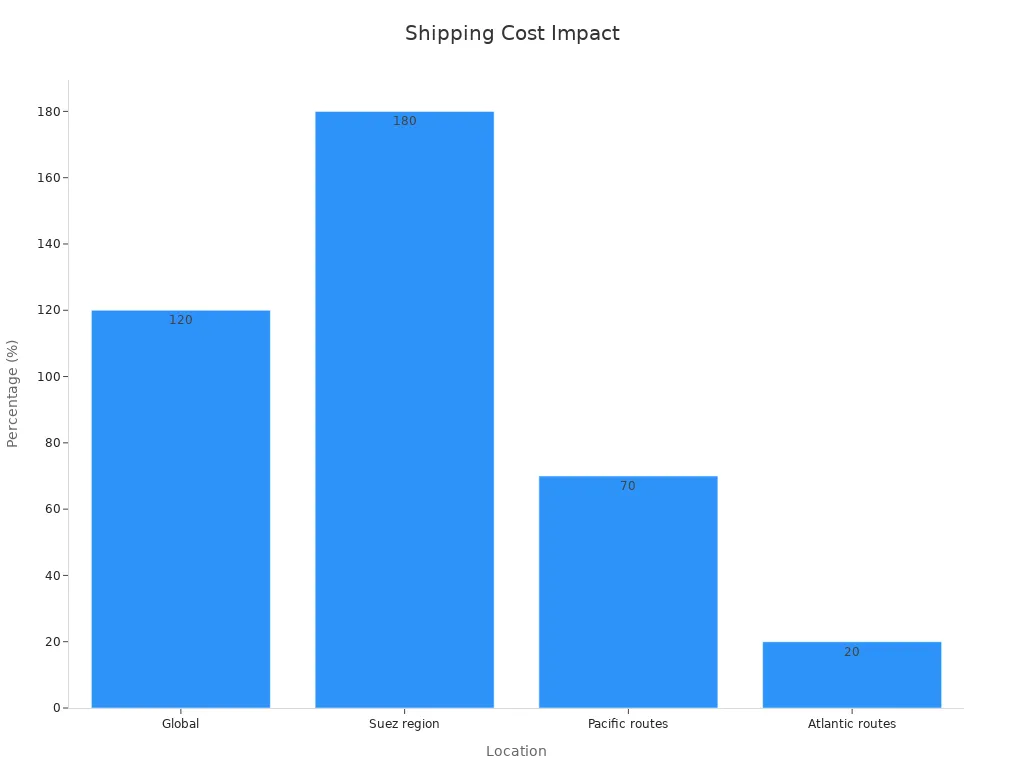
Shipping Cost Increase by Region | Suez region: ~180%, Pacific: ~70%, Atlantic: ~20% |
Rerouting Impact | +3,500 nautical miles, +14 days per voyage |
Trade Volume Impact | Declines at Eurasian ports, ~20% drop at other global ports |
The Red Sea crisis shows how a local problem can raise Ocean Shipping Costs worldwide.
Port Congestion
Port congestion remains a serious challenge for the shipping industry. In May 2024, the Port of Ningbo-Zhoushan saw average wait times nearly double from 4.6 to 8.7 days. Out of 40 Asian ports, 22 reported longer delays compared to the previous month. North American and European ports also faced rising congestion, with Hamburg experiencing an increase of over 10 hours. Studies show that a 1% rise in Asian port congestion can push freight rates up by more than 1%. Reducing congestion to pre-pandemic levels could lower shipping costs by at least 25%. These delays disrupt schedules and make it harder for shippers to plan.
Blank Sailings
Blank sailings occur when carriers cancel scheduled voyages to manage capacity. In 2020, blank sailings peaked at 12%, removing up to 30% of shipping capacity on main routes. This strategy helped carriers keep rates high, but it also reduced service frequency and reliability. Early 2023 saw blank sailings reach 21%, causing even more volatility. Shippers faced longer wait times and higher costs, sometimes paying five to ten times the normal rate. Port operators and container suppliers also struggled with unpredictable workloads and equipment shortages. Monitoring blank sailings helps businesses prepare for sudden changes in Ocean Shipping Costs.
Risk Factors
Tariffs & Trade Policy
Tariffs and trade policy changes create significant risks for global shipping. The US Trade Tariff Exposure Tool measures how industries depend on foreign suppliers and markets.
Import Exposure shows how sensitive production costs are to tariff changes on imported goods.
Export Exposure highlights risks from foreign retaliatory tariffs and trade agreement changes.
The Industry Analysis tab evaluates how specific tariffs affect costs, competitiveness, and market access.
Risk scores include metrics like Consumer Sentiment, Revenue Volatility, and International Trade.
The CLA analysis explains that tariffs can increase transportation expenses and cause supply delays. Logistics teams use freight consolidation and volume planning to manage these risks. Scenario planning and continuous monitoring help companies adapt to changing trade policies.
Recent history shows the impact of tariffs on shipping. During the Trump administration, a 145% tariff on Chinese goods led to a 25% drop in container bookings from China to the US. Sectors like apparel, textiles, and plastics saw booking declines of 45% to 59%. Over 30% of firms now list trade and tariffs as their top business concern, up from 8.3% in previous years.
Labor & Strikes
Labor disputes and strikes can disrupt shipping operations and drive up costs. The following table shows the effects of a major strike:
Metric | Value | Description |
|---|---|---|
Ground deliveries interrupted | 83% | Percentage of all ground parcel and package deliveries halted |
Combined ground and air deliveries | 63% | Percentage of all combined ground and air deliveries affected |
Total deliveries affected | 12 million | Number of parcel and package deliveries disrupted |
Customers affected | 4.9 million | Number of customers impacted, including hospitals and research organizations |
Companies affected | 1.16 million | Mostly small businesses dependent on UPS for operations |
Employees involved | 185,000 | Number of UPS employees participating in the strike |
Estimated economic output affected | 5-7% | Equivalent to $400 billion to $560 billion |
Competitors' capacity | Insufficient | Unable to handle UPS's delivery volume during the strike |
Strikes can halt millions of deliveries and affect critical sectors. Competitors often cannot absorb the extra volume, leading to capacity shortages and higher shipping costs.
Economic Uncertainty
Economic uncertainty shapes global shipping trends. The Baltic Dry Index (BDI) tracks the average price to transport dry bulk materials and serves as a key indicator.
In 2020–2021, shipping container costs rose over 500% from pre-pandemic levels.
Bulk commodity shipping costs tripled due to demand surges and logistical bottlenecks.
A 21.8% increase in shipping costs can raise domestic headline inflation by 0.15 percentage points over 12 months. The effect is larger in emerging economies and island nations. Shipping cost shocks often persist for up to a year, affecting prices and trade patterns worldwide.
Strategies for Shippers
Early Booking
Early booking remains one of the most effective ways to manage Ocean Shipping Costs and secure space during periods of high demand. Booking shipments at least five weeks in advance helps shippers lock in stable pricing and avoid last-minute rate spikes. On major trade lanes like China–U.S., early booking ensures access to reliable carriers and reduces the risk of delays caused by port congestion or sudden changes in tariffs. Logistics teams benefit from enforcing routing compliance and choosing carriers with strong customs experience. When tariff changes approach, accelerating shipments can help clear goods under lower rates, but this also increases demand and tightens capacity. Real-time quoting and the ability to switch quickly between carriers or modes further protect against cost surges.
Tip: Early booking is especially important as new ocean alliances form and capacity constraints continue due to rerouting around the Suez and Panama Canals.
Alternative Routes
Shippers can reduce risk by exploring alternative shipping routes. Dynamic routing software allows real-time adjustments to avoid congested or high-cost gateways. Redirecting shipments through secondary ports, such as Savannah, can lower per-container fees by 10-15% compared to busier ports. Multi-modal options, like combining ocean, rail, and truck, help avoid delays and demurrage charges. Flexible contracts let shippers shift volumes between suppliers and transport modes as market conditions change.
Diversification
Diversifying supply chains strengthens resilience against disruptions and cost spikes. Companies now map their supplier networks to identify vulnerabilities. Many shift sourcing from China to countries like Vietnam, India, or Mexico to benefit from favorable trade agreements and reduce duties. Using split shipments and multiple logistics routes spreads risk and stabilizes freight costs. Technology, such as Transportation Management Systems, supports real-time route optimization and tariff forecasting.
Diversification Strategy | Benefit |
|---|---|
Multi-country sourcing | Reduces tariff exposure |
Split shipments | Lowers risk of delays |
Nearshoring | Shortens transit times |
Agility & Flexibility
Agile and flexible supply chains adapt quickly to market changes. Shippers use tools like AI-driven load optimization to cut empty miles and reduce fuel costs. Flexible contracts, including spot market and short-term agreements, allow rapid response to demand shifts and tariff changes. Enhanced visibility tools help manage port congestion and shipment delays. Cloud-based systems support quick operational adjustments, such as rerouting or equipment swaps. These strategies protect margins and improve resilience during periods of volatility.
Companies that embrace agility and flexibility often save millions by negotiating better rates and responding faster to market disruptions.
Ocean Shipping Costs will likely remain unpredictable through late 2025. Companies that use demand forecasting tools and AI-driven models can better manage inventory and avoid costly disruptions. Industry studies show that poor planning can lead to major financial losses, such as a million-dollar shutdown from missing raw materials. Only one-third of firms focus enough on risk, so proactive strategies matter. Shippers should stay alert, adjust quickly, and use data to guide decisions in a changing market.
FAQ
What causes ocean shipping costs to change so quickly?
Ocean shipping costs change due to demand, capacity, and global events. Disruptions like port congestion or conflicts can raise rates fast. Carriers may also adjust prices based on fuel costs and new regulations.
Note: Shippers should monitor news and market updates for sudden changes.
How do Red Sea disruptions affect shipping rates?
Red Sea disruptions force ships to take longer routes. This increases travel time and fuel use. As a result, shipping rates rise, and schedules become less reliable.
Can technology help lower ocean shipping costs?
Yes. Technology like AI, IoT, and digital tracking helps carriers optimize routes and reduce fuel use. These tools can lower costs and improve shipment visibility.
Why is early booking important for shippers?
Early booking secures space and stable rates. It helps shippers avoid last-minute price spikes and delays, especially during busy seasons or when capacity is tight.
What strategies help manage shipping cost volatility?
Shippers can use early booking, diversify supply chains, and explore alternative routes. Staying flexible and monitoring tariffs also helps manage cost changes.
Strategy | Benefit |
|---|---|
Early booking | Stable rates |
Diversification | Lower risk |
Alternative routes | Fewer delays |
See Also
Discover The Latest Innovations In Sea Freight Logistics
Understanding Emerging Trends In Logistics Risk Management
Top Five Trends Shaping Future Supply Chain Efficiency
In-Depth Look At The Future Of LTL Freight Services
Analyzing Economic Strategies For Supply Chain Cost Reduction